
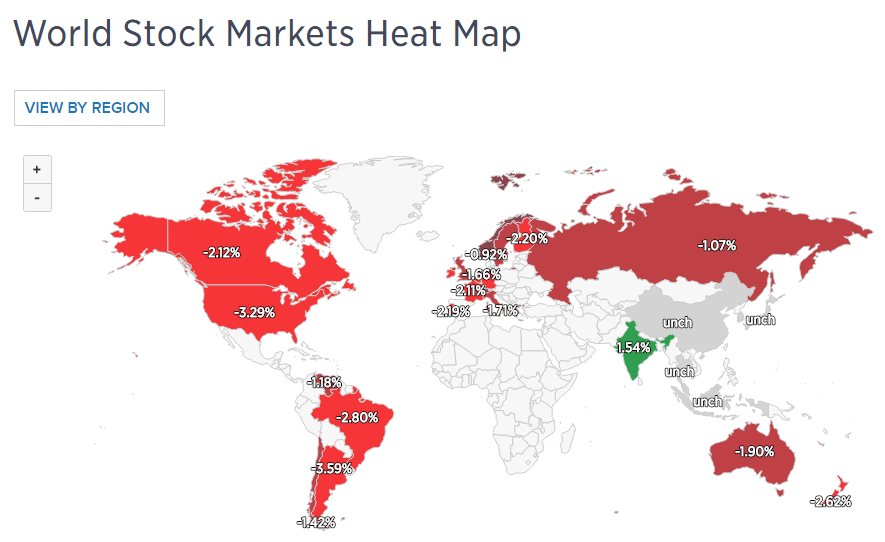
The first CNBC World Stock Markets Heat Map shows Wednesday’s big drop in North/South American, British and European markets.
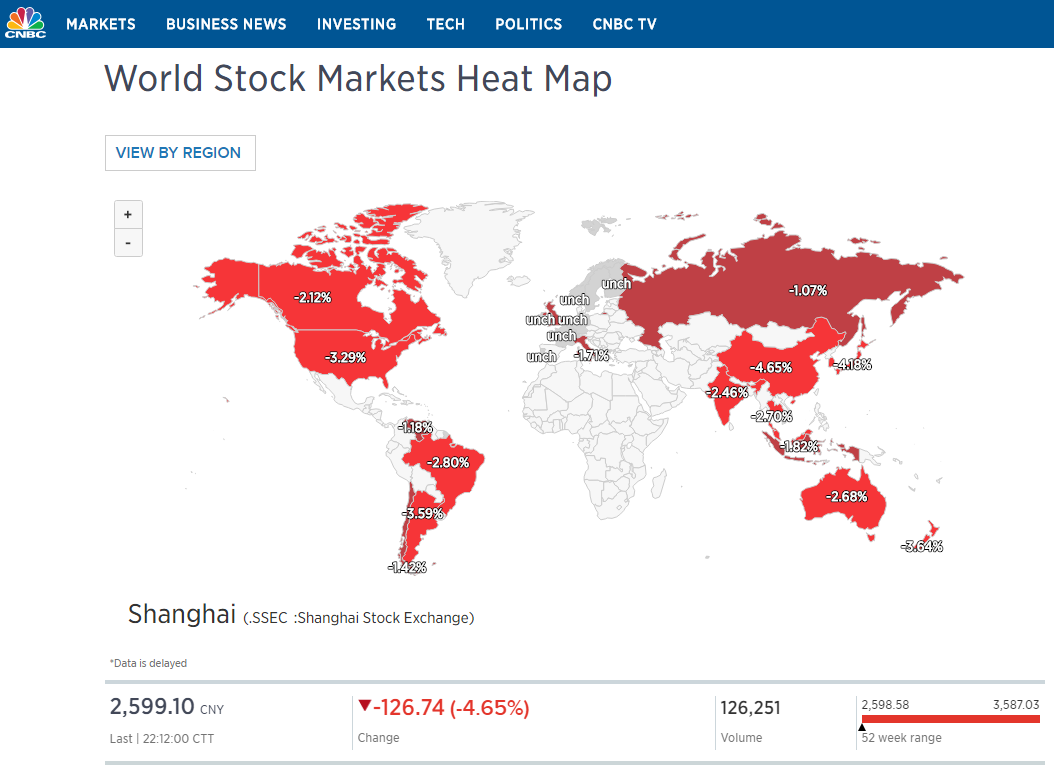
The second Heat Map shows the subsequent overnight drop in the Asian, etc. markets. At the time of writing this article (around 1:30 am ET October 11), the SSEC is down 4.65%.
The Shanghai Index (SSEC) continued its freefall from its January highs with a breakaway gap below a large trading range and continued to fall in early overnight trading in China, as shown on the daily chart below.
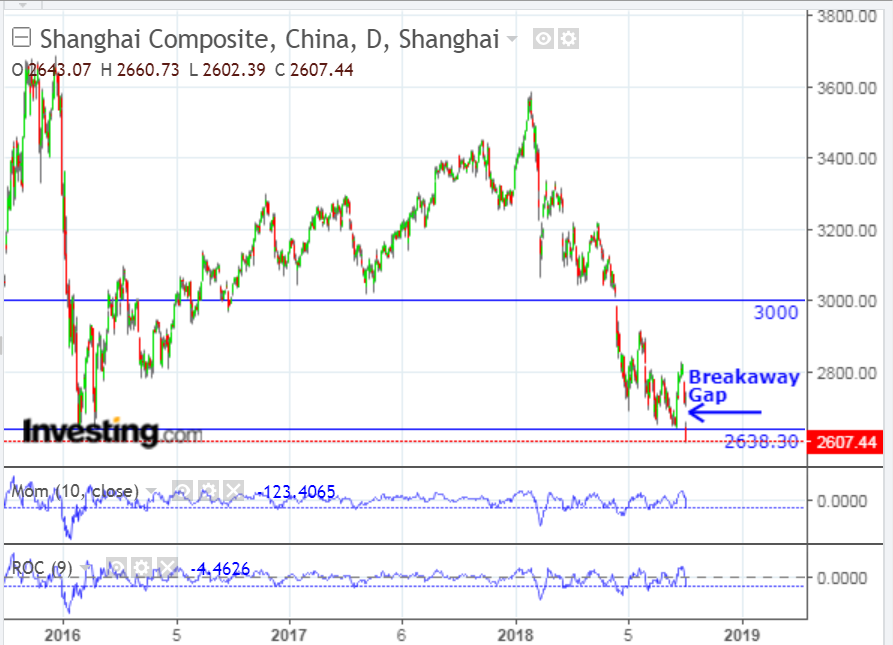
In my post of August 6, I mentioned that the SSEC was in a bear market and that if price broke below its last swing low of 2638.30 on the monthly timeframe, it could be headed for its next major support level at 2260, or lower.
Since then, it has continued to slide and price has just broken below that swing low with this gap down, as shown on the following monthly chart.
Both the momentum and rate-of-change technical indicators are in decline, are well below zero and are making a new low…hinting of further weakness ahead on this timeframe.

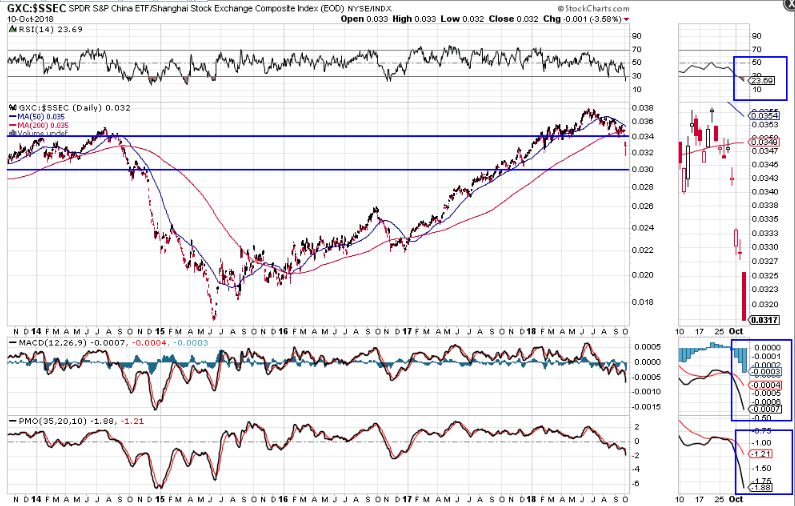
In my post of August 15, I mentioned that the China Financials ETF (GXC), on a ratio basis compared with the SSEC, was weaker than the index and that it would be important for the financials sector to attract new buyers, otherwise, we’d see the selling continue, or even, accelerate in Chinese markets.
The following daily ratio chart of the GXC:SSEC ratio shows that (as of Wednesday’s close) price has continued to weaken and has broken below near-term support of 0.034…on downside accelerating RSI, MACD and PMO indicators…signalling that we still don’t see financial support for the SSEC.
Price on this ratio may well continue to drop to its next major support level of 0.030, or lower, before it, either begins to stabilize, or bounces.
Should price on the SSEC drop another 240 points, or so, that would constitute a measured move comparable with the size of its recent consolidation range (from which the breakaway gap has dropped), bringing price to around 2360…100 points above a potential target of 2260. As such, we may see price overshoot the 2360 level and drop to somewhere in between that and 2260, before it, either begins to stabilize, or bounces.
Keep an eye on the MOM, ROC, RSI, MACD and PMO indicators for potential clues as to future price direction for, both the SSEC and the GXC:SSEC ratio.
