
What I’m really enjoying about SlopeRules is that every time I use it, I think of at least one important new feature to add. See, with SlopeCharts, for me, it’s basically perfect. I use it dozens of hours every week, and – – like I say – – it’s absolutely perfect. There’s nothing else I want it to do.
SlopeRules, on the other hand, is a newborn baby, and there’s all kinds of things I want to teach it.
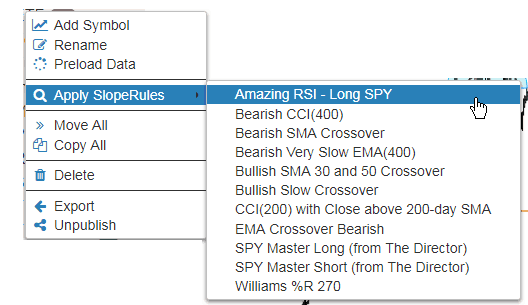
I decided to have a little fun and try to tease out what SlopeRules set seemed to work well with my ETF list. So I right-clicked on my ETF watchlist (which has 60 symbols) and went to Apply SlopeRules, one by one:
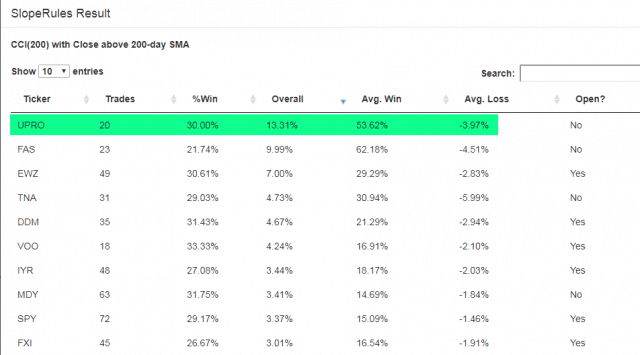
So I started trying out different SlopeRules that seemed interesting. Here’s a result list which is a dud for a couple of reasons. After I sorted by the “Overall” column (which indicates, on the whole, how well a rule set did), the percentages were quite modest. Worse still, the best-performing stocks only had two or three trades each, which is statistically insignificant. Time to move on.
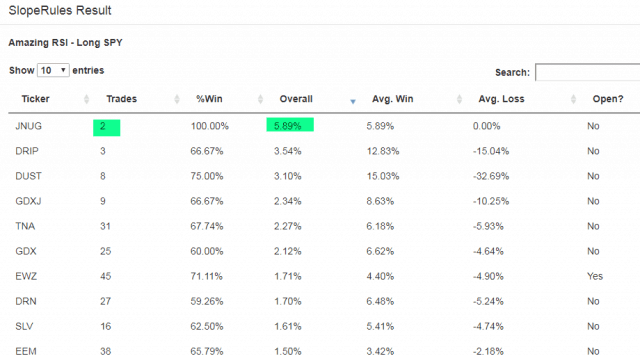
This looks more promising! In this case, the best performers have plenty of trades with nice fat average wins and tiny average losses. You may also notice in the “Open” column that there are even a few open positions.
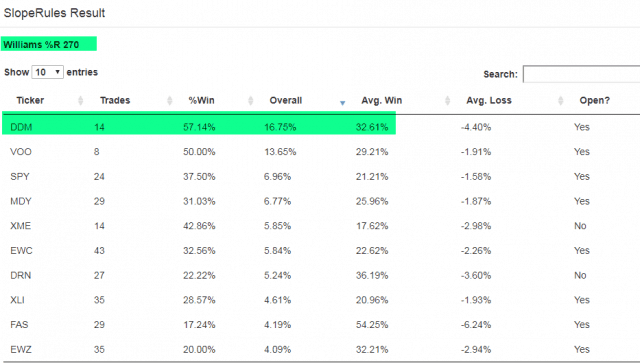
My Williams %R SlopeRules yielded even higher overall scores, but substantially smaller trade counts, so I think the one above is the standout.
We’re already on the trail of something better than this “hit or miss” approach, but I’ve got to say, experimenting with these rule sets in this fashion can get really mesmerizing. I urge you to check it out.
