Let’s take a step-by-step example as to how a SlopeRules set would be constructed and improved.
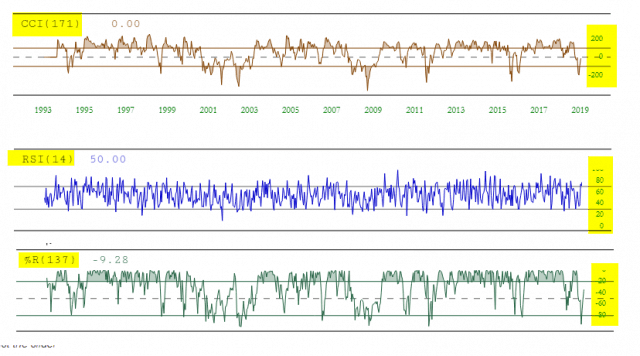
When basing rules on indicators, it’s important to know which levels and crossover points are important to different indicators. Below, for instance, are some examples of the CCI, RSI, and %R indicators. As you can see, the y-axis values (highlighted on the right) vary quite a bit from study to study.
So let’s make a bullish SlopeRules set with the CCI specifically. In order to have a small, tidy set of “hits” for this example, we’ll use a very slow CCI with the largest number available for its calculation: 400. So within SlopeCharts we would:
- Choose the SlopeRules item from the Tools menu;
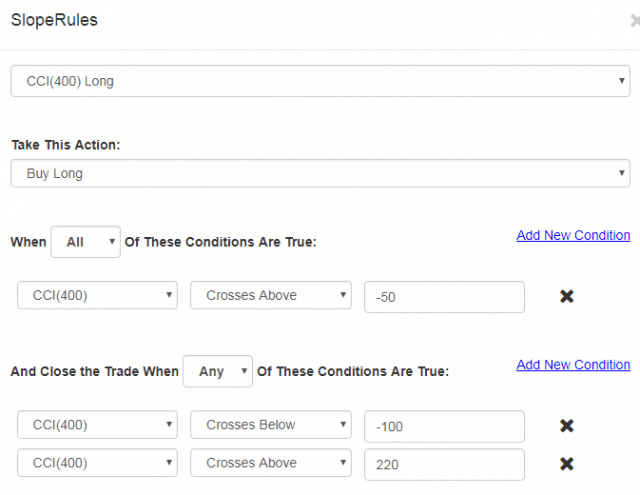
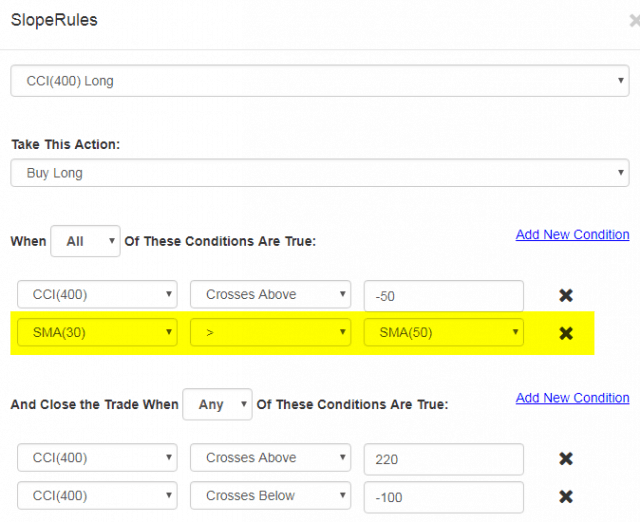
- I would construct the CCI(400) value by way of the New Value choice on the dropdown menu. I would then add one rule for entering a position (the CCI crossing above the level -50).
- Add two rules for exiting a position, both of which also use the CCI(400). One of them is for values above 220, suggesting a powerful move higher. The other is for values crossing below -100, meaning the stock is rolling over and not doing well, thus exiting the trade. Importantly, the “Any” is chosen so that either of these rules will trigger an exit.
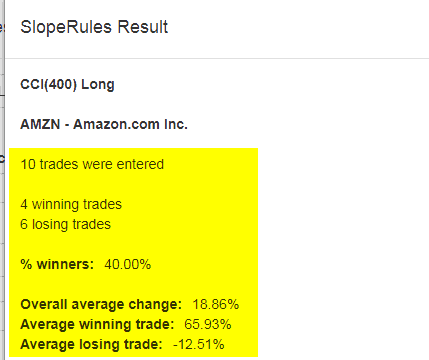
Clicking on the Test button and entering AMZN as the test symbol, we get the results below. There are ten trades, 40% of which are winners. The average winning trade is about five times bigger than the average losing trade, so overall the average change per trade is pretty good: 18.86%.
However, let’s refine this a little in order to execute trades when the stock is in an uptrend. This will reduce the number of trades but might filter out some of the losers. So we add another rule, highlighted below, which requires that the simple 30-day moving average value be higher than the 50-day moving average value (indicating the stock is generally trending higher).
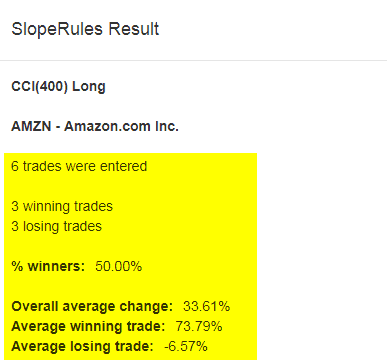
Using the Test button on AMZN once again, we get different results. Only six trades were executed. Half were winners, half were losers. But notice how much the overall average change has improved: it’s up to 33.61%, nearly double the prior amount. This was accomplished with just one simple extra rule.
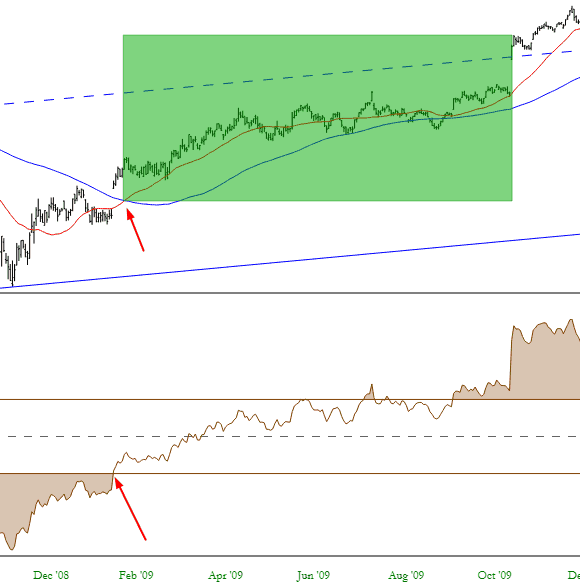
Examining the SlopeChart for AMZN shows each trade highlighted with a green rectangle. Looking at one of these closely, you can see how the entry was made when both criteria were satisfied. Once the CCI went above 220, the trade was exited with a healthy profit.