
At the end of December I posted the SPX monthly chart for subscribers at theartofchart.net talking about the significance of the monthly middle band in bear market moves. I posted the chart on a post here on 24th January when it had become clear that such a close back above was possible, and we saw that close back above at the end of January. What I said in the notes on the chart below was that in the event that we were to see a clear monthly close back above the monthly middle band, then the last time that such a close failed to deliver a retest of the all time high before a significant lower low (under 2346) was in 1957. Obviously I am therefore now seriously considering the possibility that SPX may be on the way to a retest of the all time high, and given the overall setup that might well then be the second high of a major double top.
SPX monthly chart:
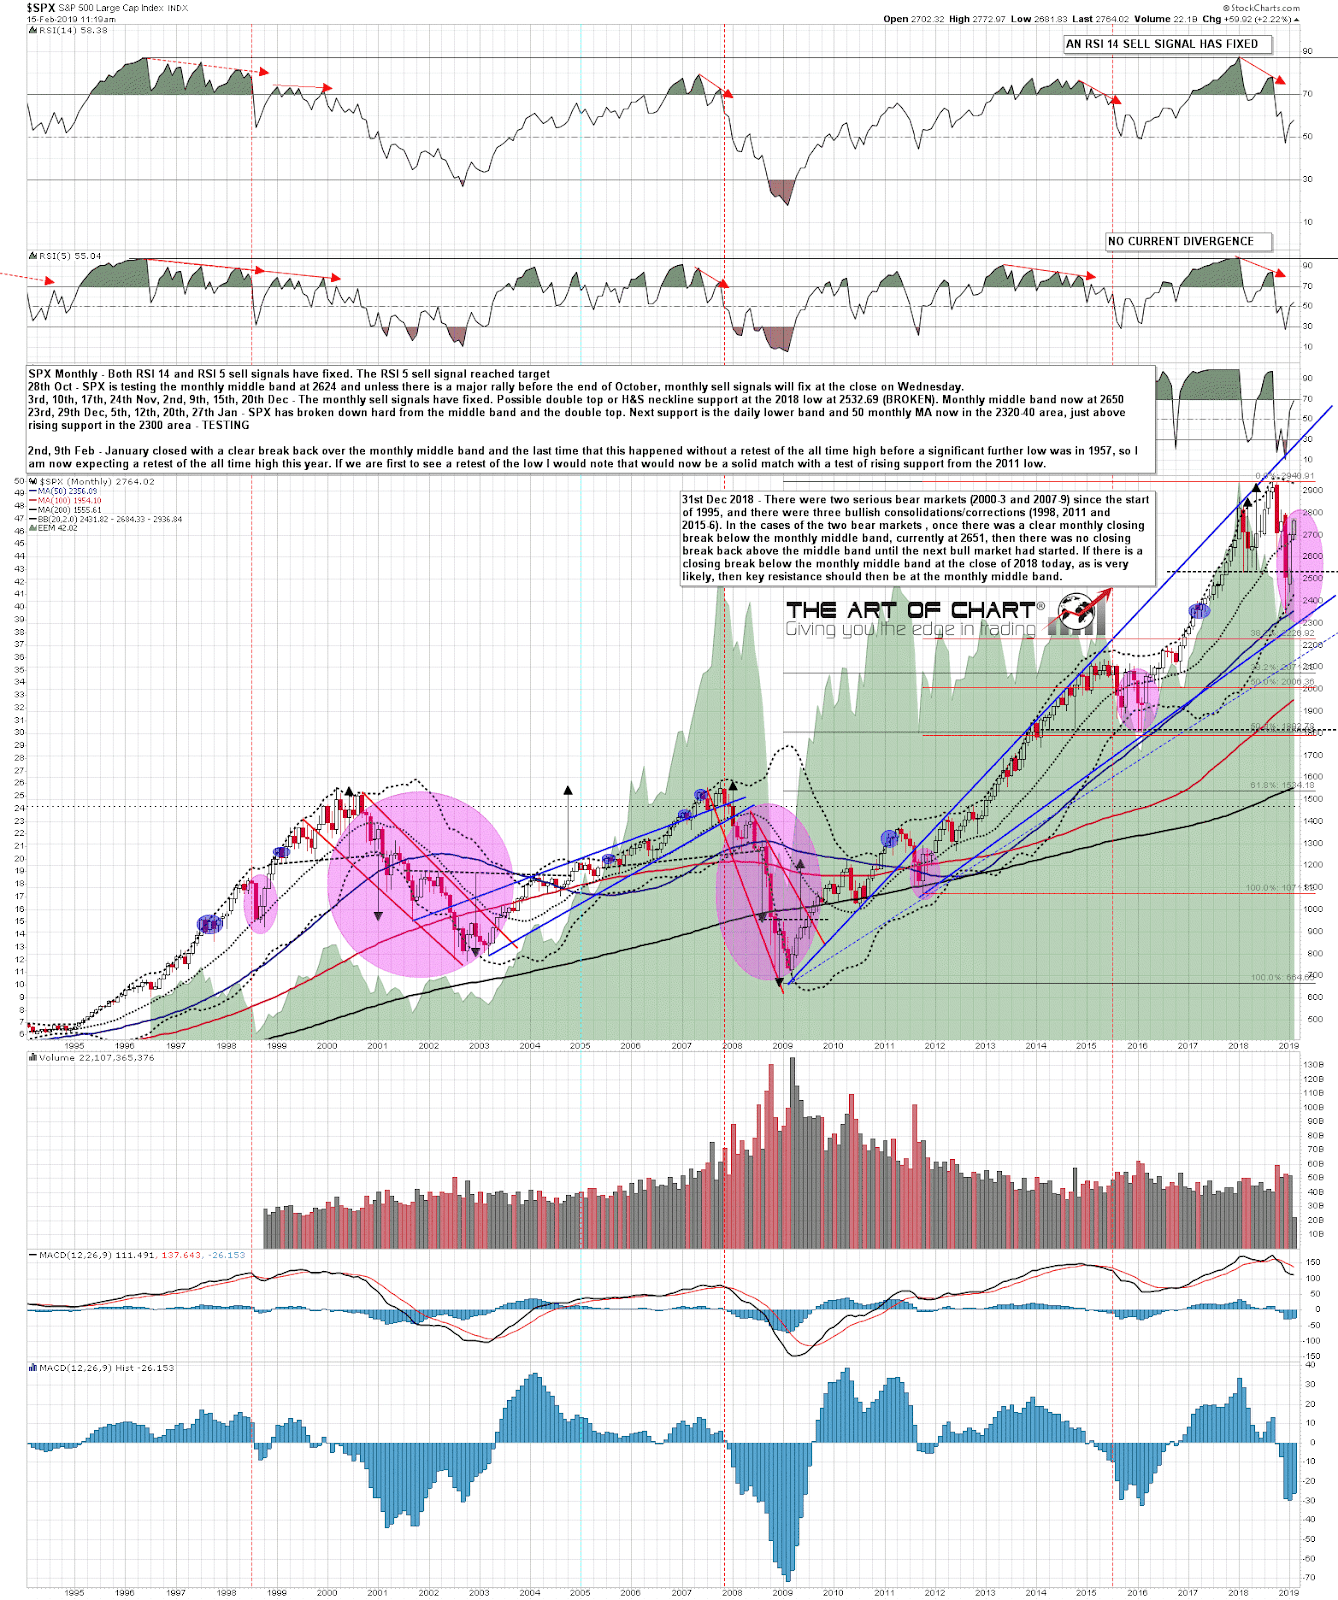
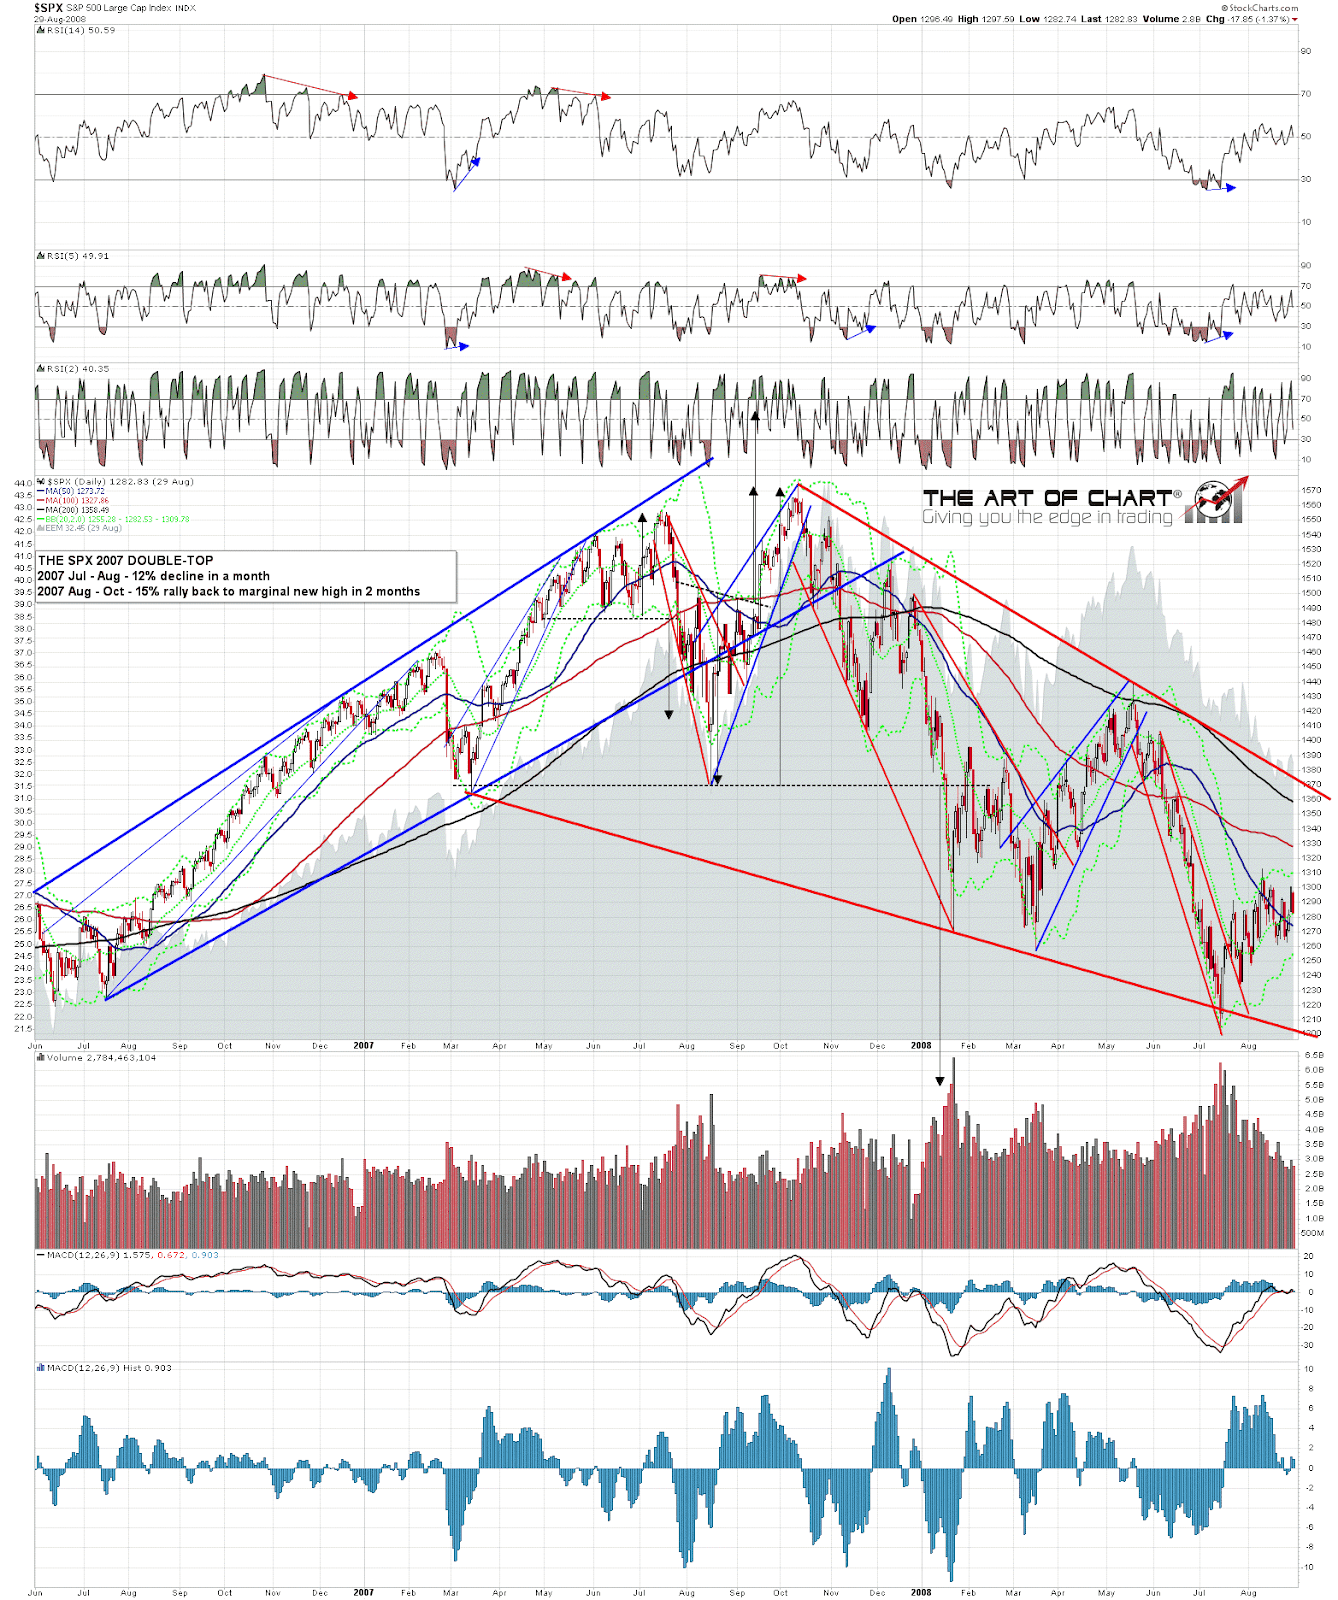
Now the rally since the late December low has already taken SPX up a very impressive 18%, and to extend that into a retest of the all time high would push that to over 25%. That would be an amazing move if we were to see that retest soon, and historical examples of that kind of move are limited, but fast high retests aren’t unknown and there is a very decent example of a fast retest of a high to make a double top at the 2007 high, and that high retest was a 15% rally in two months. That’s not a comparison that would be too far away from an ATH retest here if we were to see that soon.
SPX daily chart 2007 double-top:
On the daily chart SPX found some resistance at the 200dma and the 50 week moving average, but SPX has broken above both and looks as though it may be going higher. That brings an interesting possibility that I had been considering as a low probability into higher relief and I want to flag that as a possible path now, so I’ll be looking at that in detail on the hourly chart:
SPX daily chart:
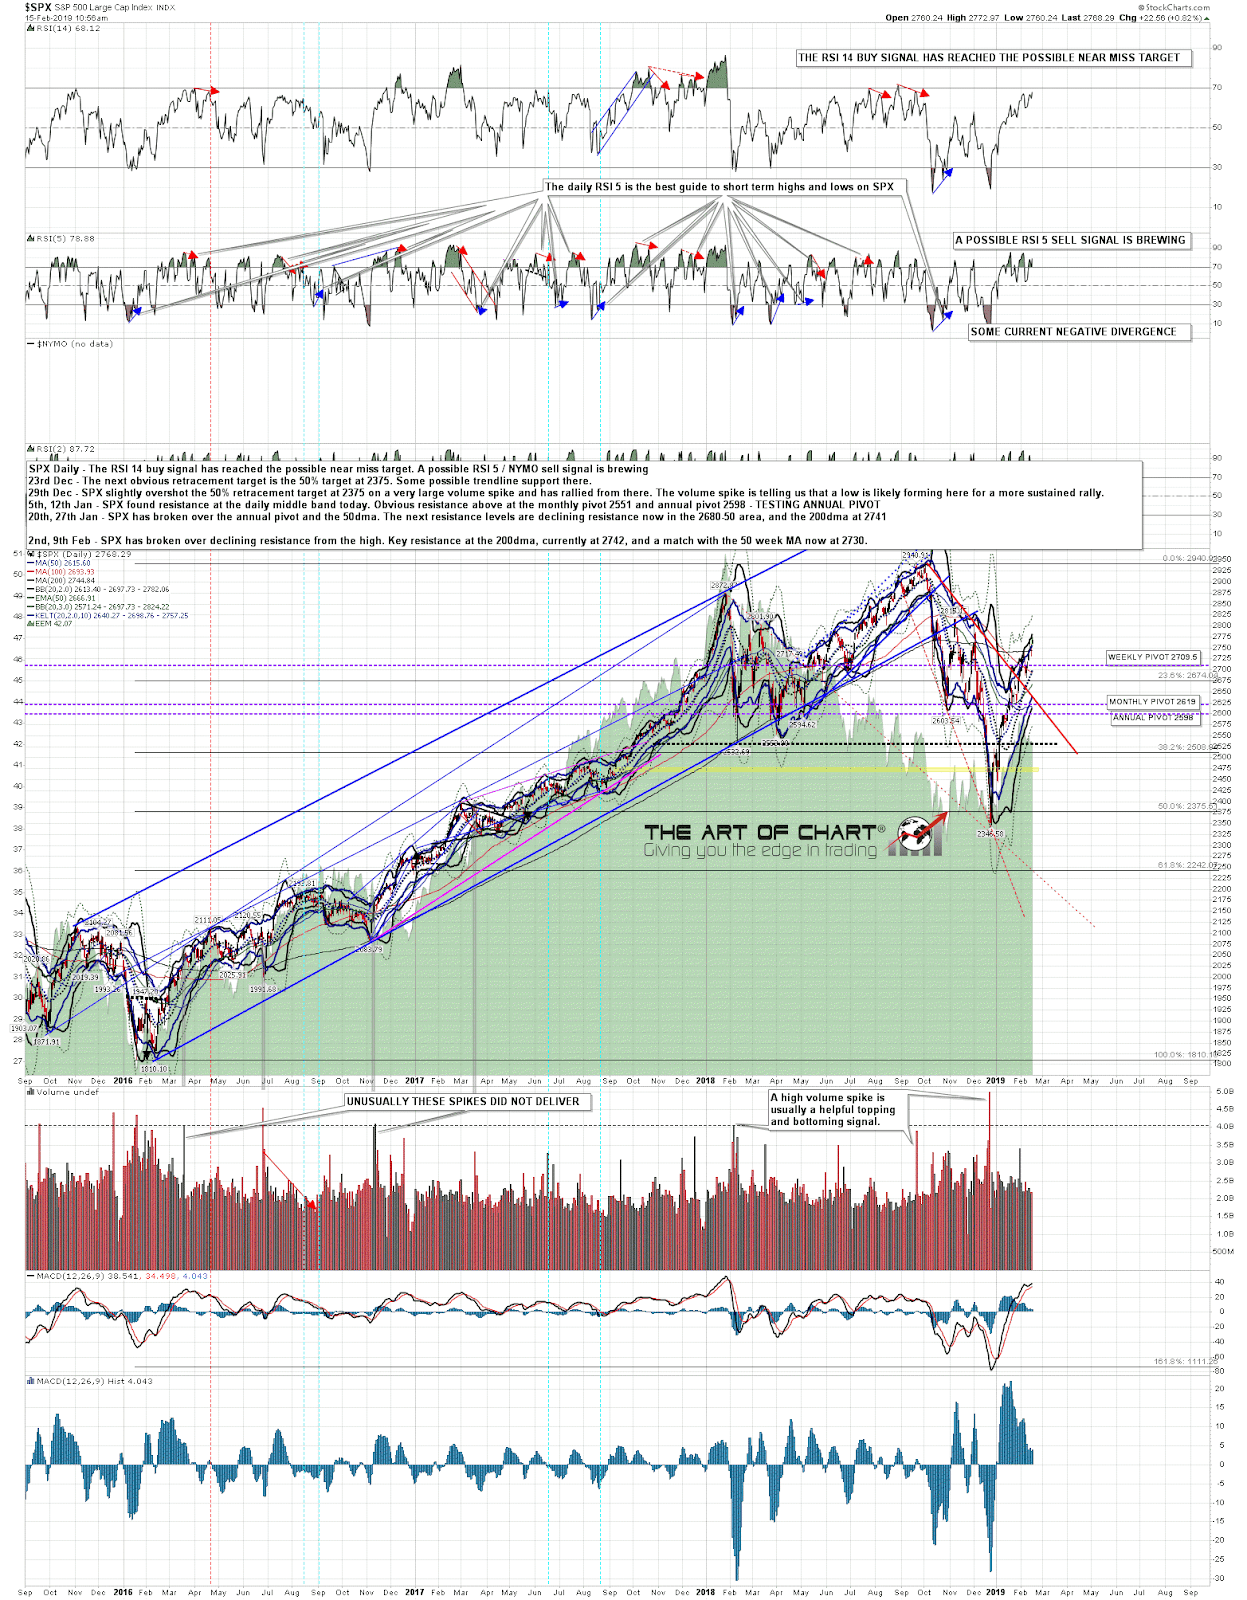
Early this week I noticed that last week’s low at 2681 had established a rising channel from the December low. I wasn’t thinking that channel would be likely to hold through this week but I mentioned it to subscribers this week as the key support level that needed to be broken, on the expected retracement, to kill off the possibility that SPX might be starting a move towards wedge or channel resistance on the chart. Obviously that support trendline has not broken this week and both need to be considered now as potential targets.
The main rising channel is rising at 42 handles or so every week and the all time high could be reached within the rising channel before the end of February. Rising channel support is closing this week in the 2740 area, that will be at 2782ish at the end of next week, and 2825ish at the close on March 1st. That is obviously a very steep rate of increase, but equally that is a bit less than the average weekly rise since the rally started and, having come this far, it could still extend further after this week’s break over the important resistance levels at the 200dma and 50 week MA. The two resistance trendlines shown are the obvious rising wedge resistance option, currently in the 2810 area and due to reach the 2840 area by the end of next week, and the rising channel resistance option, currently in the 2890 area and due to reach the 2930s by the end of next week.
As long as there is no break of rising channel support, then those are the obvious trendline resistance options. There is a lot of negative RSI divergence here, the channel could break down at any time, and would break down if SPX just stopped here at 2770 for a week, but if it doesn’t break down then those targets are on the table and an all time high retest could be seen within two or three weeks. In the absence of a break below channel support that trendline would be above the all time high by the end of March. Food for thought.
SPX 60min chart:

Everyone have a great weekend. 🙂
