I saw a string of remarks in the comments thread that were kicked off by this:
Slope initially began as a blog, so this is where most of the website’s content resides. Here we have tens of thousands of posts dating back over a decade. These are listed in reverse chronological order. Click on any category icon below to see posts tagged with that particular subject, or click on a word in the category cloud on the right side of the screen for more specific choices.
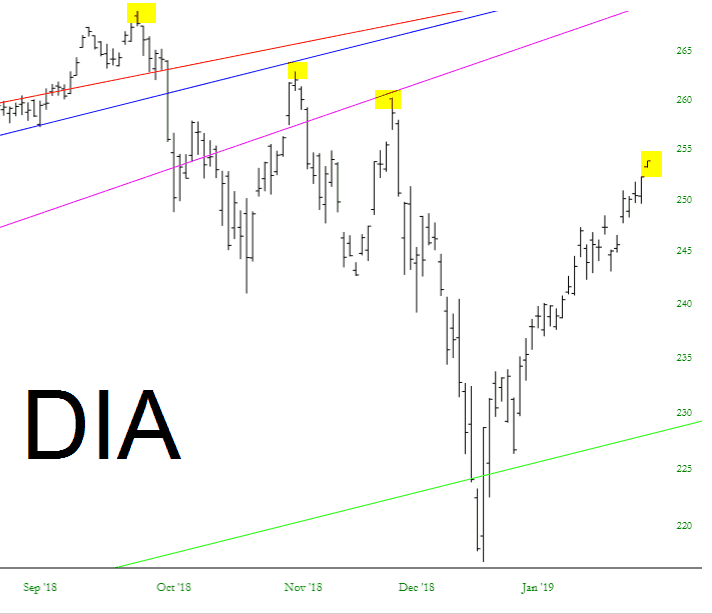
It’s getting dicey – – especially for QQQ – – but for the moment, the series of lower highs since last September are still hanging on for dear life.
I have a rather unique vantage point as the owner of this little corner of the Internet. People from various parts of the world know me by way of Slope as well as my show on tastytrade, and some of the bears among them (God love ’em) consider me their ursine patron saint, so when things are going badly (like, oh, the past six weeks nonstop) they reach out to me.
Well, last night, this is pretty much what I experienced:

Let’s take a step-by-step example as to how a SlopeRules set would be constructed and improved.
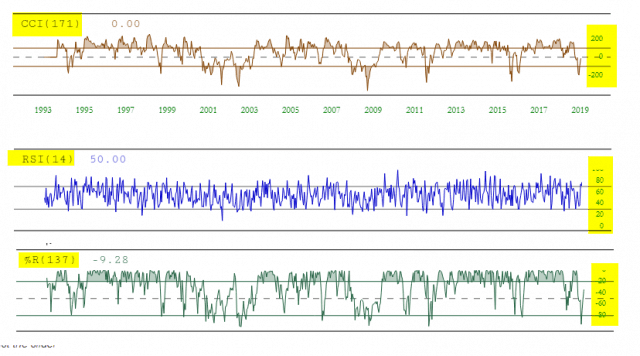
When basing rules on indicators, it’s important to know which levels and crossover points are important to different indicators. Below, for instance, are some examples of the CCI, RSI, and %R indicators. As you can see, the y-axis values (highlighted on the right) vary quite a bit from study to study.
As the earnings season starts to wind down, it seems the big message from the FAANG stocks is that, earnings projections be damned, this market wants to go up. Just look at what we’ve seen from the components:
