
My apologies for the lack of an update last week, which was particularly busy. Today I’m going to do a multi-timeframe review of where SPX is now, and the implications longer term of this seven week uptrend having risen this far.
Just to mention, we are doing our monthly free public Chart Chat on Sunday, and if you’d like to attend, you can register for that on our February Free Webinars page. We are also starting our next four week Trader’s Boot Camp on February 18th and if you’re interested you can register for that on our Trader’s Boot Camp February page, though we do charge a modest fee for that of course.
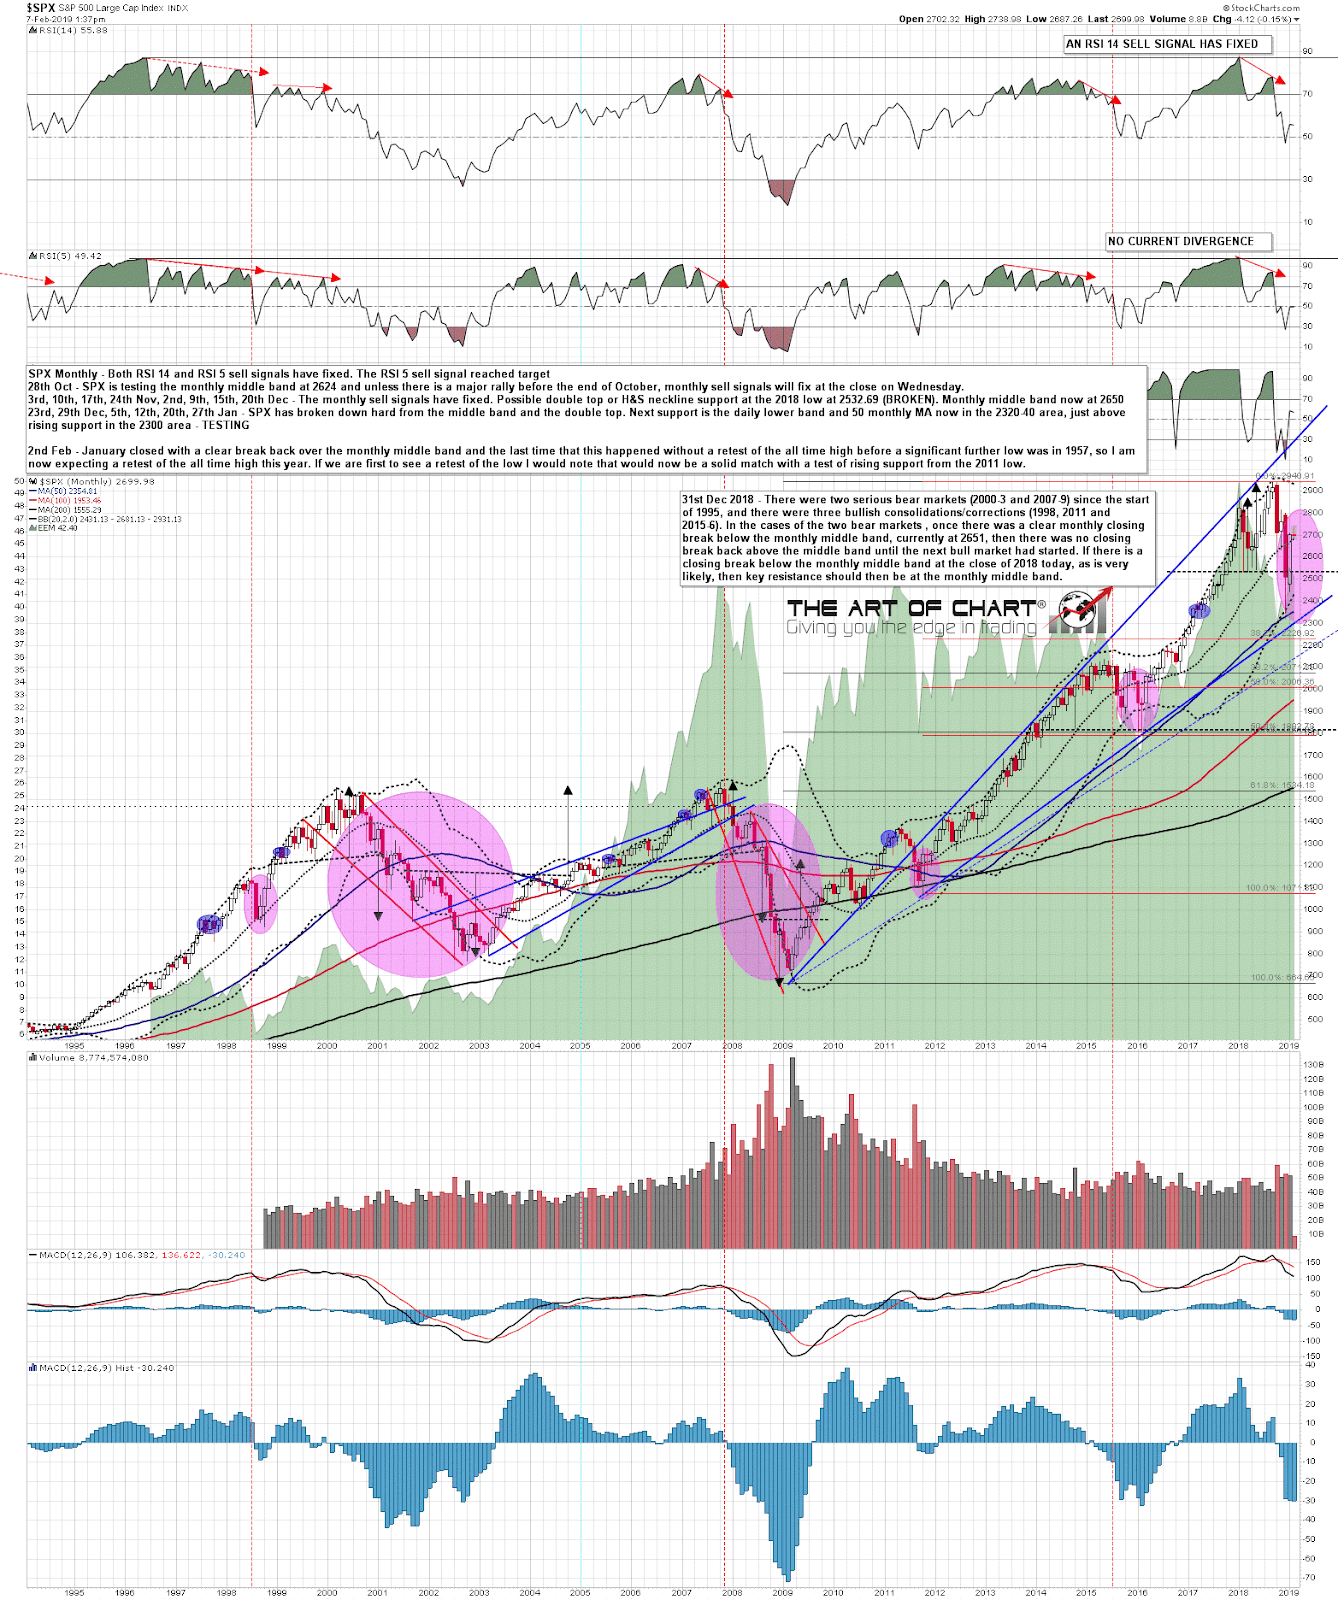
One thing I was talking about was the importance of the monthly close in January relative to the monthly middle band. Historically this has been very important resistance after a serious bear move has started, and since 1957 every clear monthly close back above the monthly middle band at this stage has always delivered a retest of the all time high before any serious lower lows were made. We saw that clear monthly close back above that monthly middle band at the end of January. That high retest has sometimes made the second high of a large double top of course, although on many occasions that has been the start of a new leg up.
On caveat here is that Stan is of the view that the nature of the market may have changed since the 2009 in that Fed interventions in the market have since been frequent. I’m keeping an open mind but respecting this statistic until demonstrated otherwise.
What I would add though is that the most bullish thing that we could see here IMO on the bigger picture would be a retest of the December low into a test of the rising support trendline from the 2011 low. If that trendline held the next obvious target would then become the corresponding rising megaphone resistance trendline, currently in the 3150 – 3200 area and obviously rising. Food for thought.
SPX monthly chart:
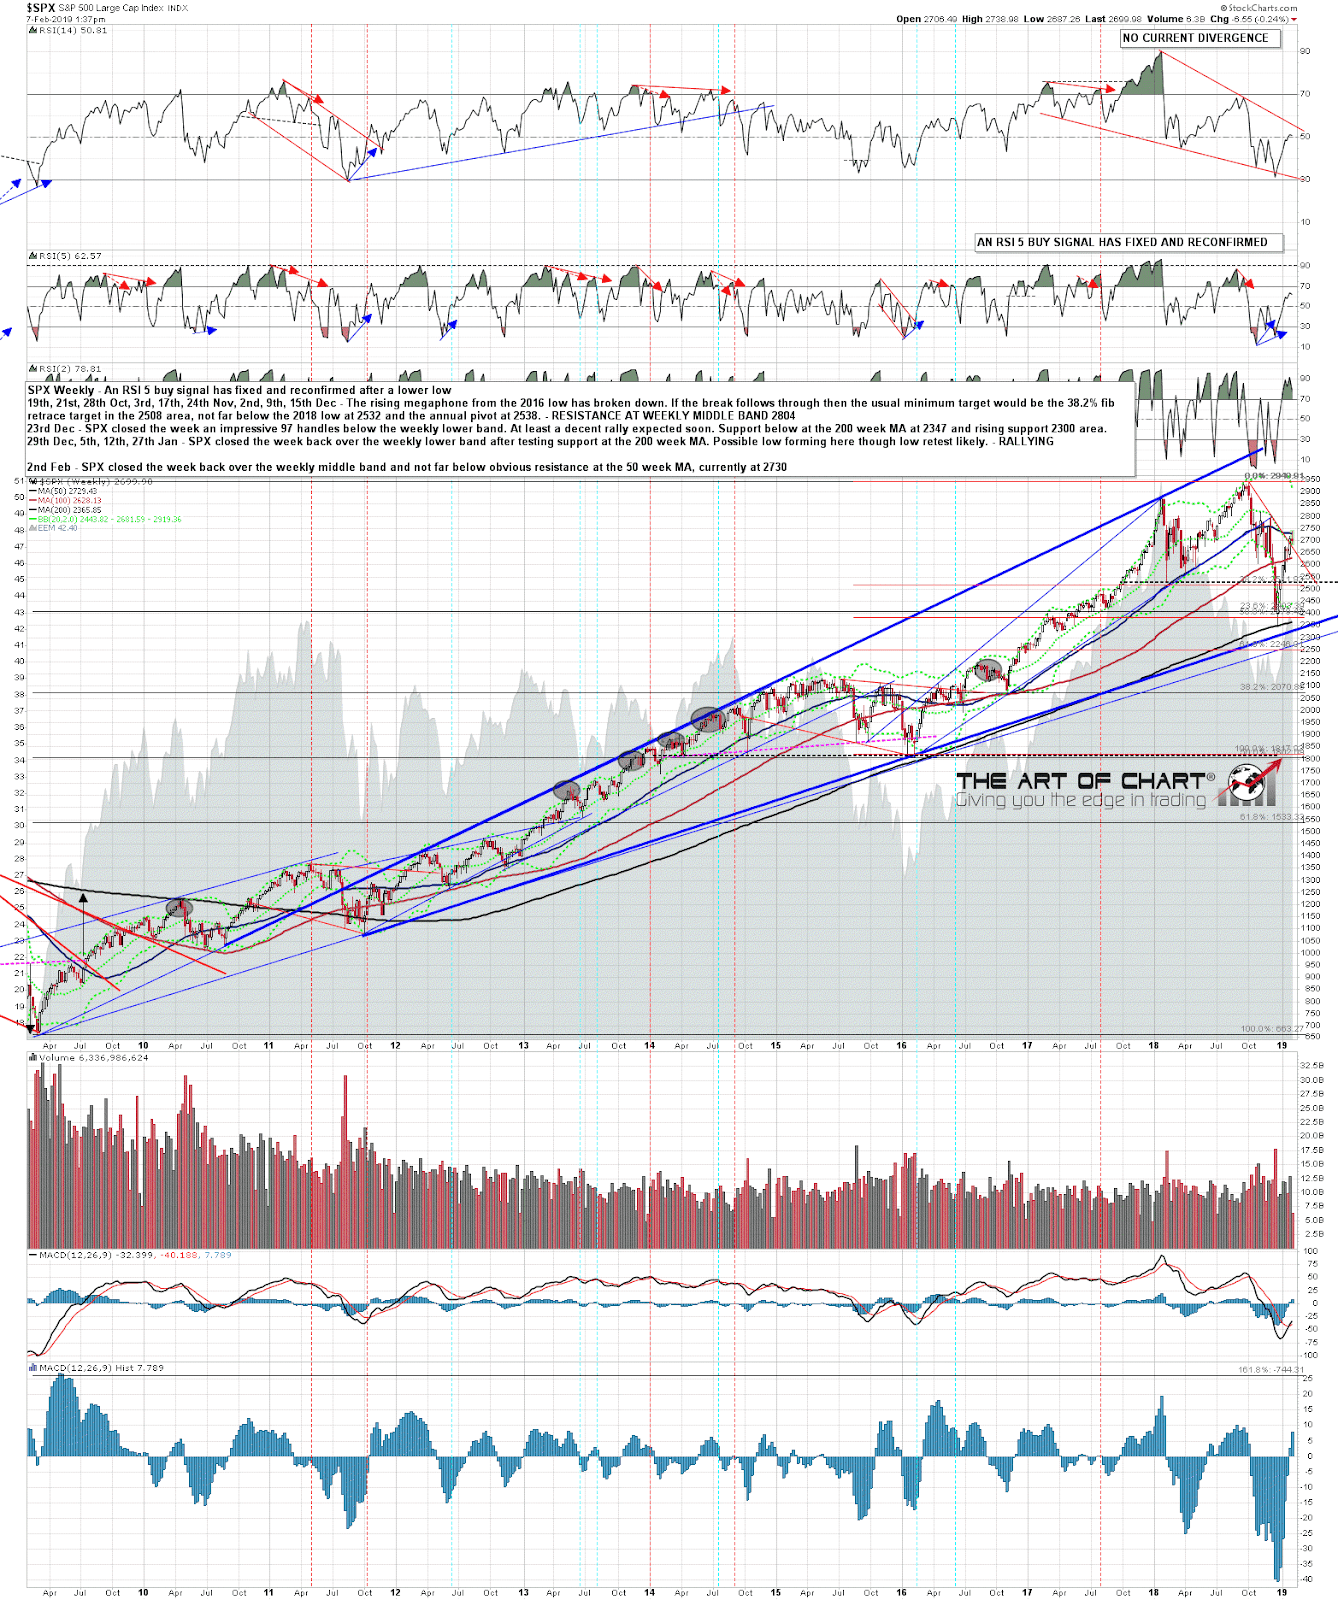
On the weekly chart the key resistance level here is the weekly middle band in the 2730 area. You can see from the chart comments last week on the weekly and daily charts that I was flagging the weekly middle band and 200dma (2740 area) as the next big resistance area, and these are holding so far.
SPX weekly chart:
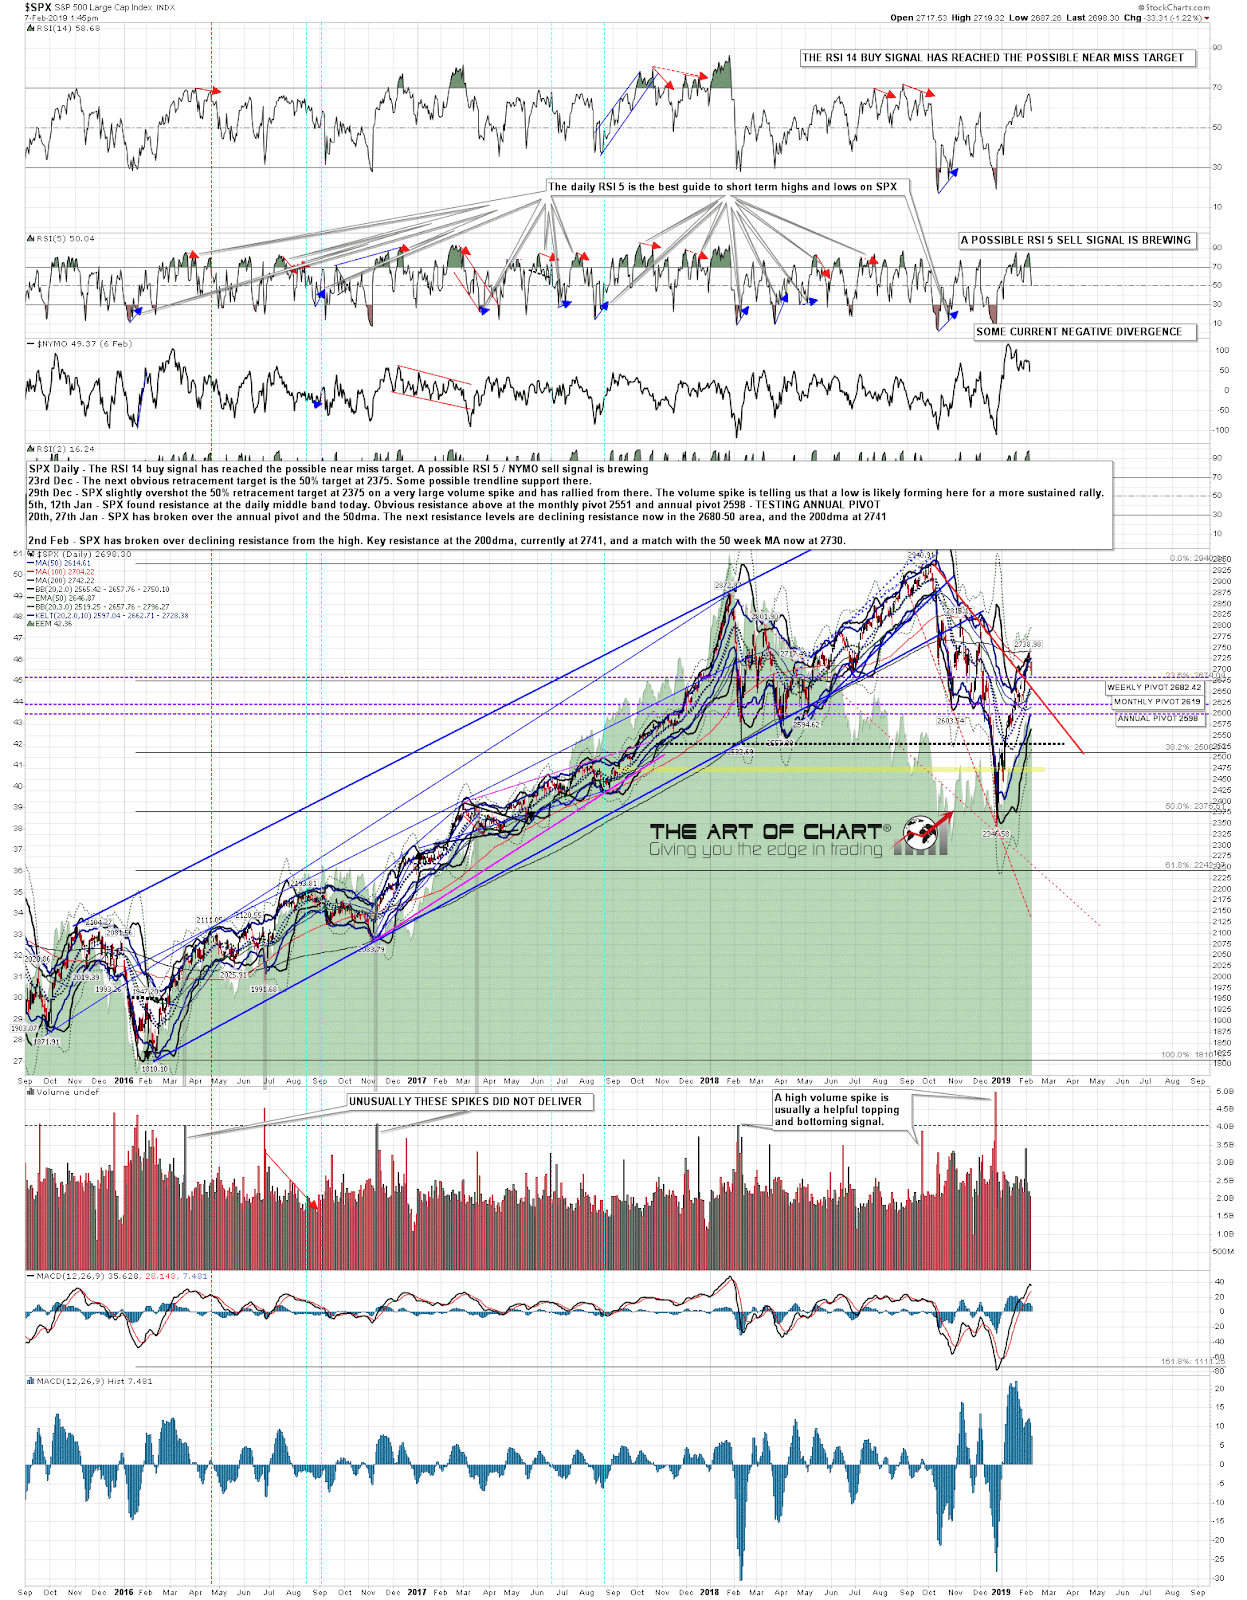
On the daily chart the high this week was a couple of handles below the 200dma and this should be at least a decent retracement starting here. On the daily RSI the daily RSI 14 buy signal has now reached the possible near miss target, and there is a strong possible RSI 5 / NYMO sell signal that may fix at the close today, depending on whether we see a rally into that close. If so, that should confirm the short term high here.
SPX daily chart:
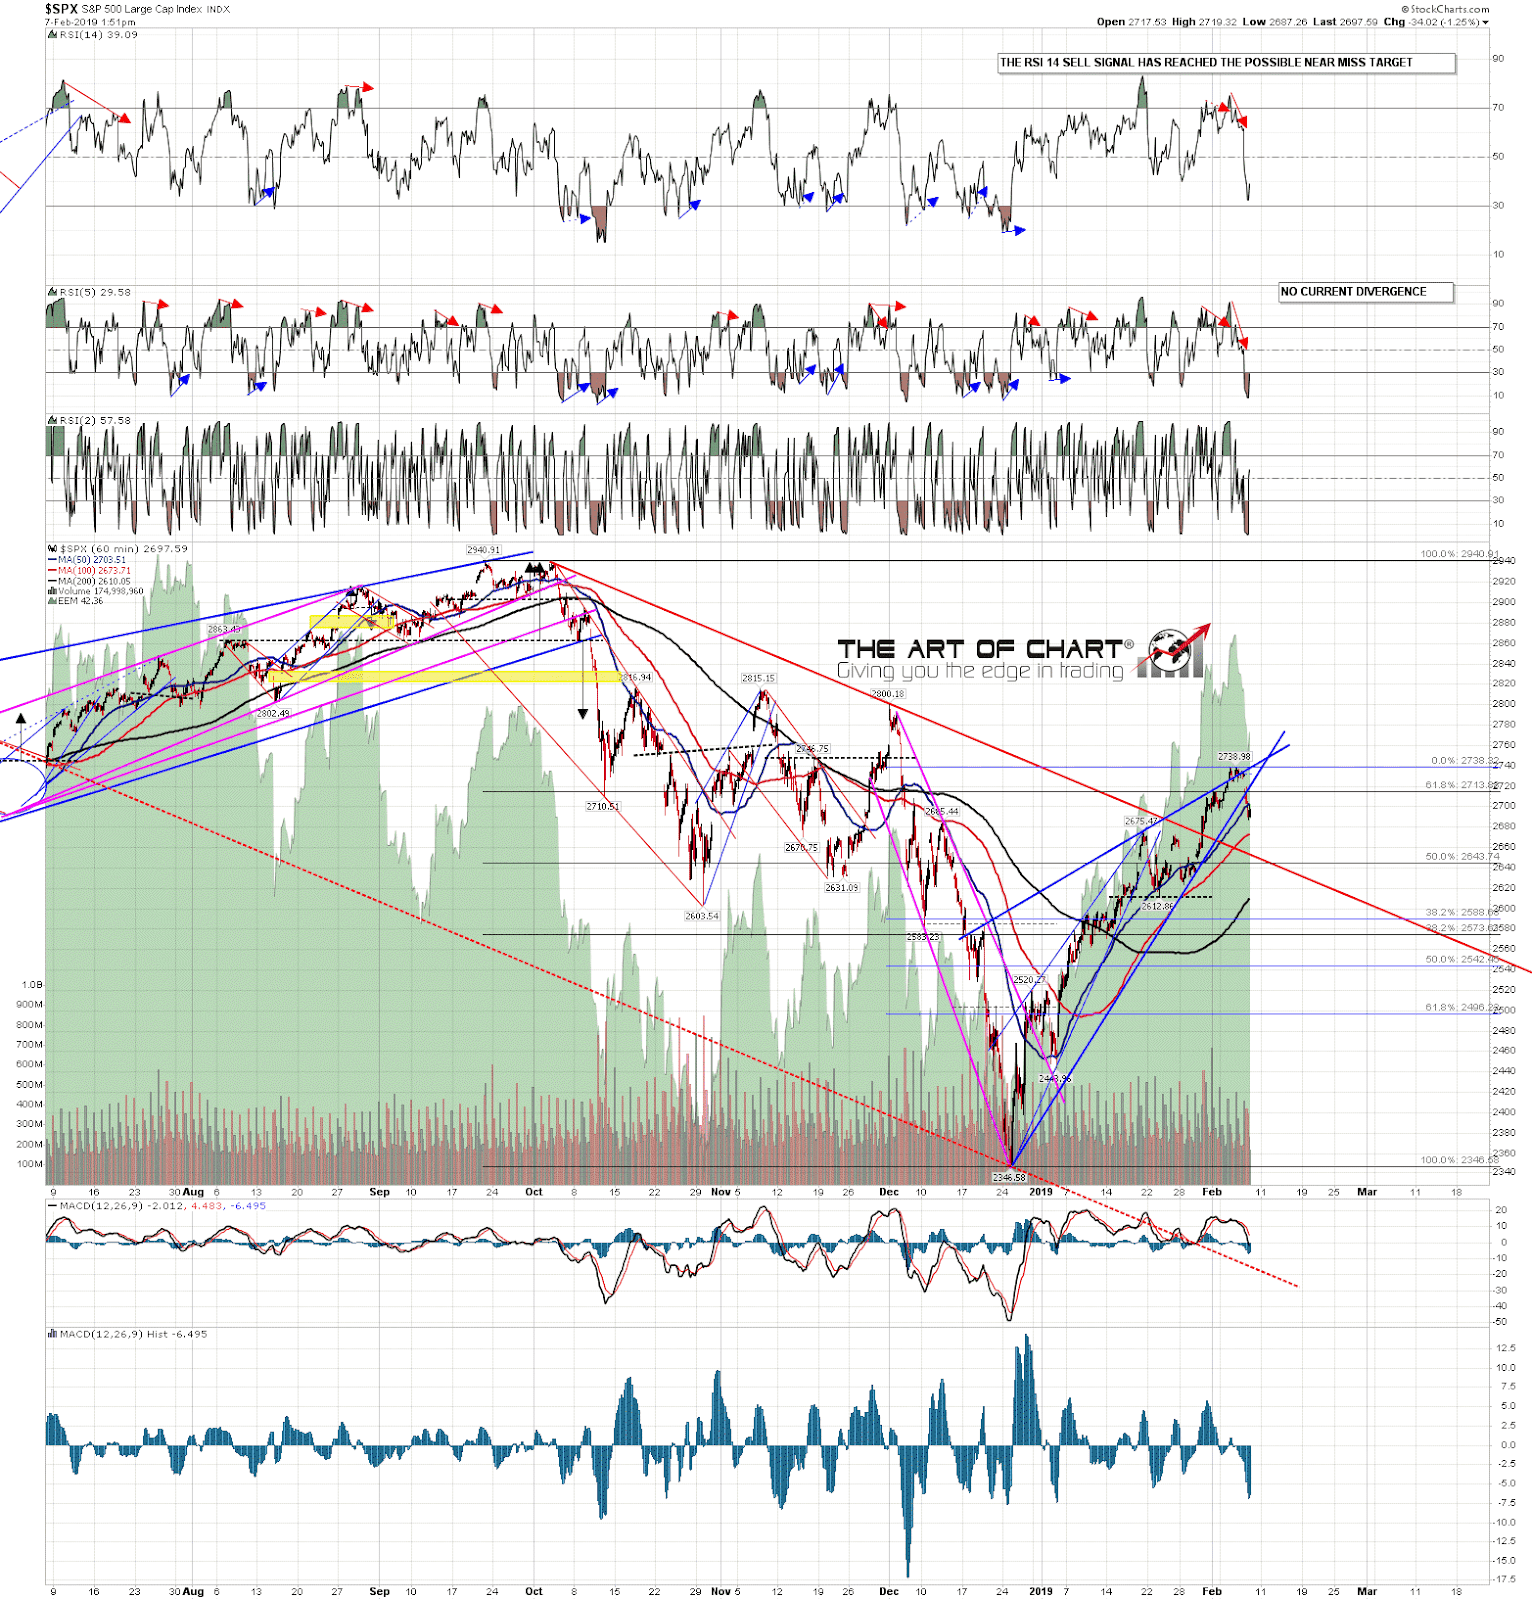
On the hourly chart a decent quality rising wedge has broken down today. Subject to a topping pattern forming here and continued failure at the 200dma, I’d expect to see at least a 38.2% fib retracement into the 2588 area at this point with the obvious other target areas being the 50% at 2542, the 61.8% at 2496, and the full retracement of the wedge back to 2346. For that last option, a retest that tested and held the rising support trendline from the 2011 low not far below could deliver an impressively bullish scenario for 2019.
SPX 60min chart:
I’m planning another post tomorrow taking a broader view, but that’s a thorough snapshot of where I see SPX being here and now. Until tomorrow.
