
We’ve got something very cool brewing in the Slope of Hope laboratory. I’m not going to go too deeply into it, but suffice it to say we are doing some serious number-crunching to tease out optimal parameters for SlopeRules.
As it is now, putting a rule set together involves a lot of random guesses. I suspect it’s this way with a lot of system testing – – just wild-ass guesses about what parameters to use.
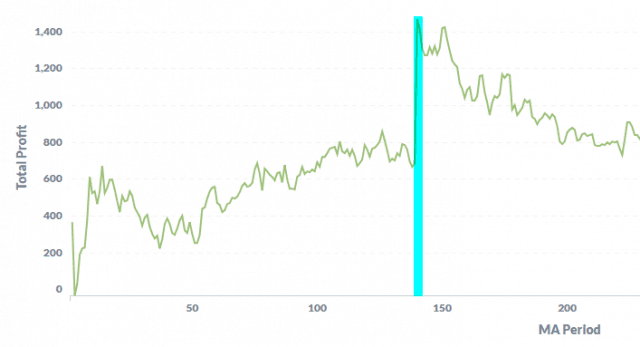
We’re taking a more scientific approach to it. For instance, in the S&P 100 stocks, it turns out that the 272-day simple moving average for Qualcomm is quite effective. The number of winning trades is terrible – 22% – but the overall effectiveness is quite good.

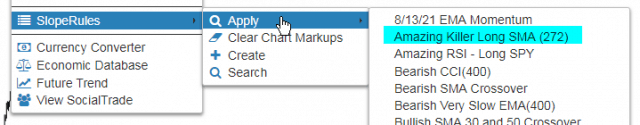
I’ve published this little rule, by the way, which is here:
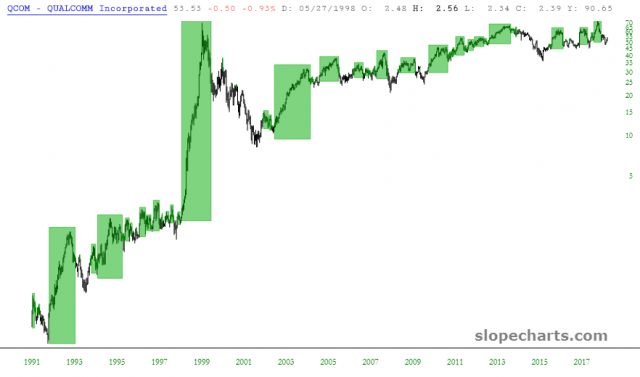
And here’s what it looks like on QCOM in SlopeCharts.
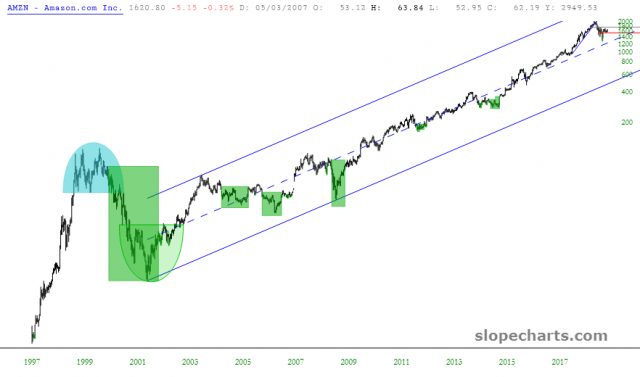
I was curious to see about short-sales (naturally), and AMZN, of all things, had the best result with a 366-day simple moving average. Just look at that winning percentage. (Although, given the persistence of the bull market, the profit is puny).
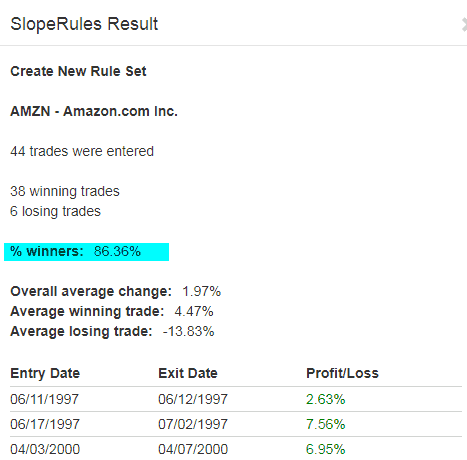
Here, by the way, is the SlopeCharts of AMZN with this rule set:
I am probably going to be rolling out the first iteration of this soon.
The Slope Optimizer (that’s all I can think of now…………Sloptimizer just doesn’t work) will probably eventually be restricted to Diamond members only. We shall see. But it’s coming.
