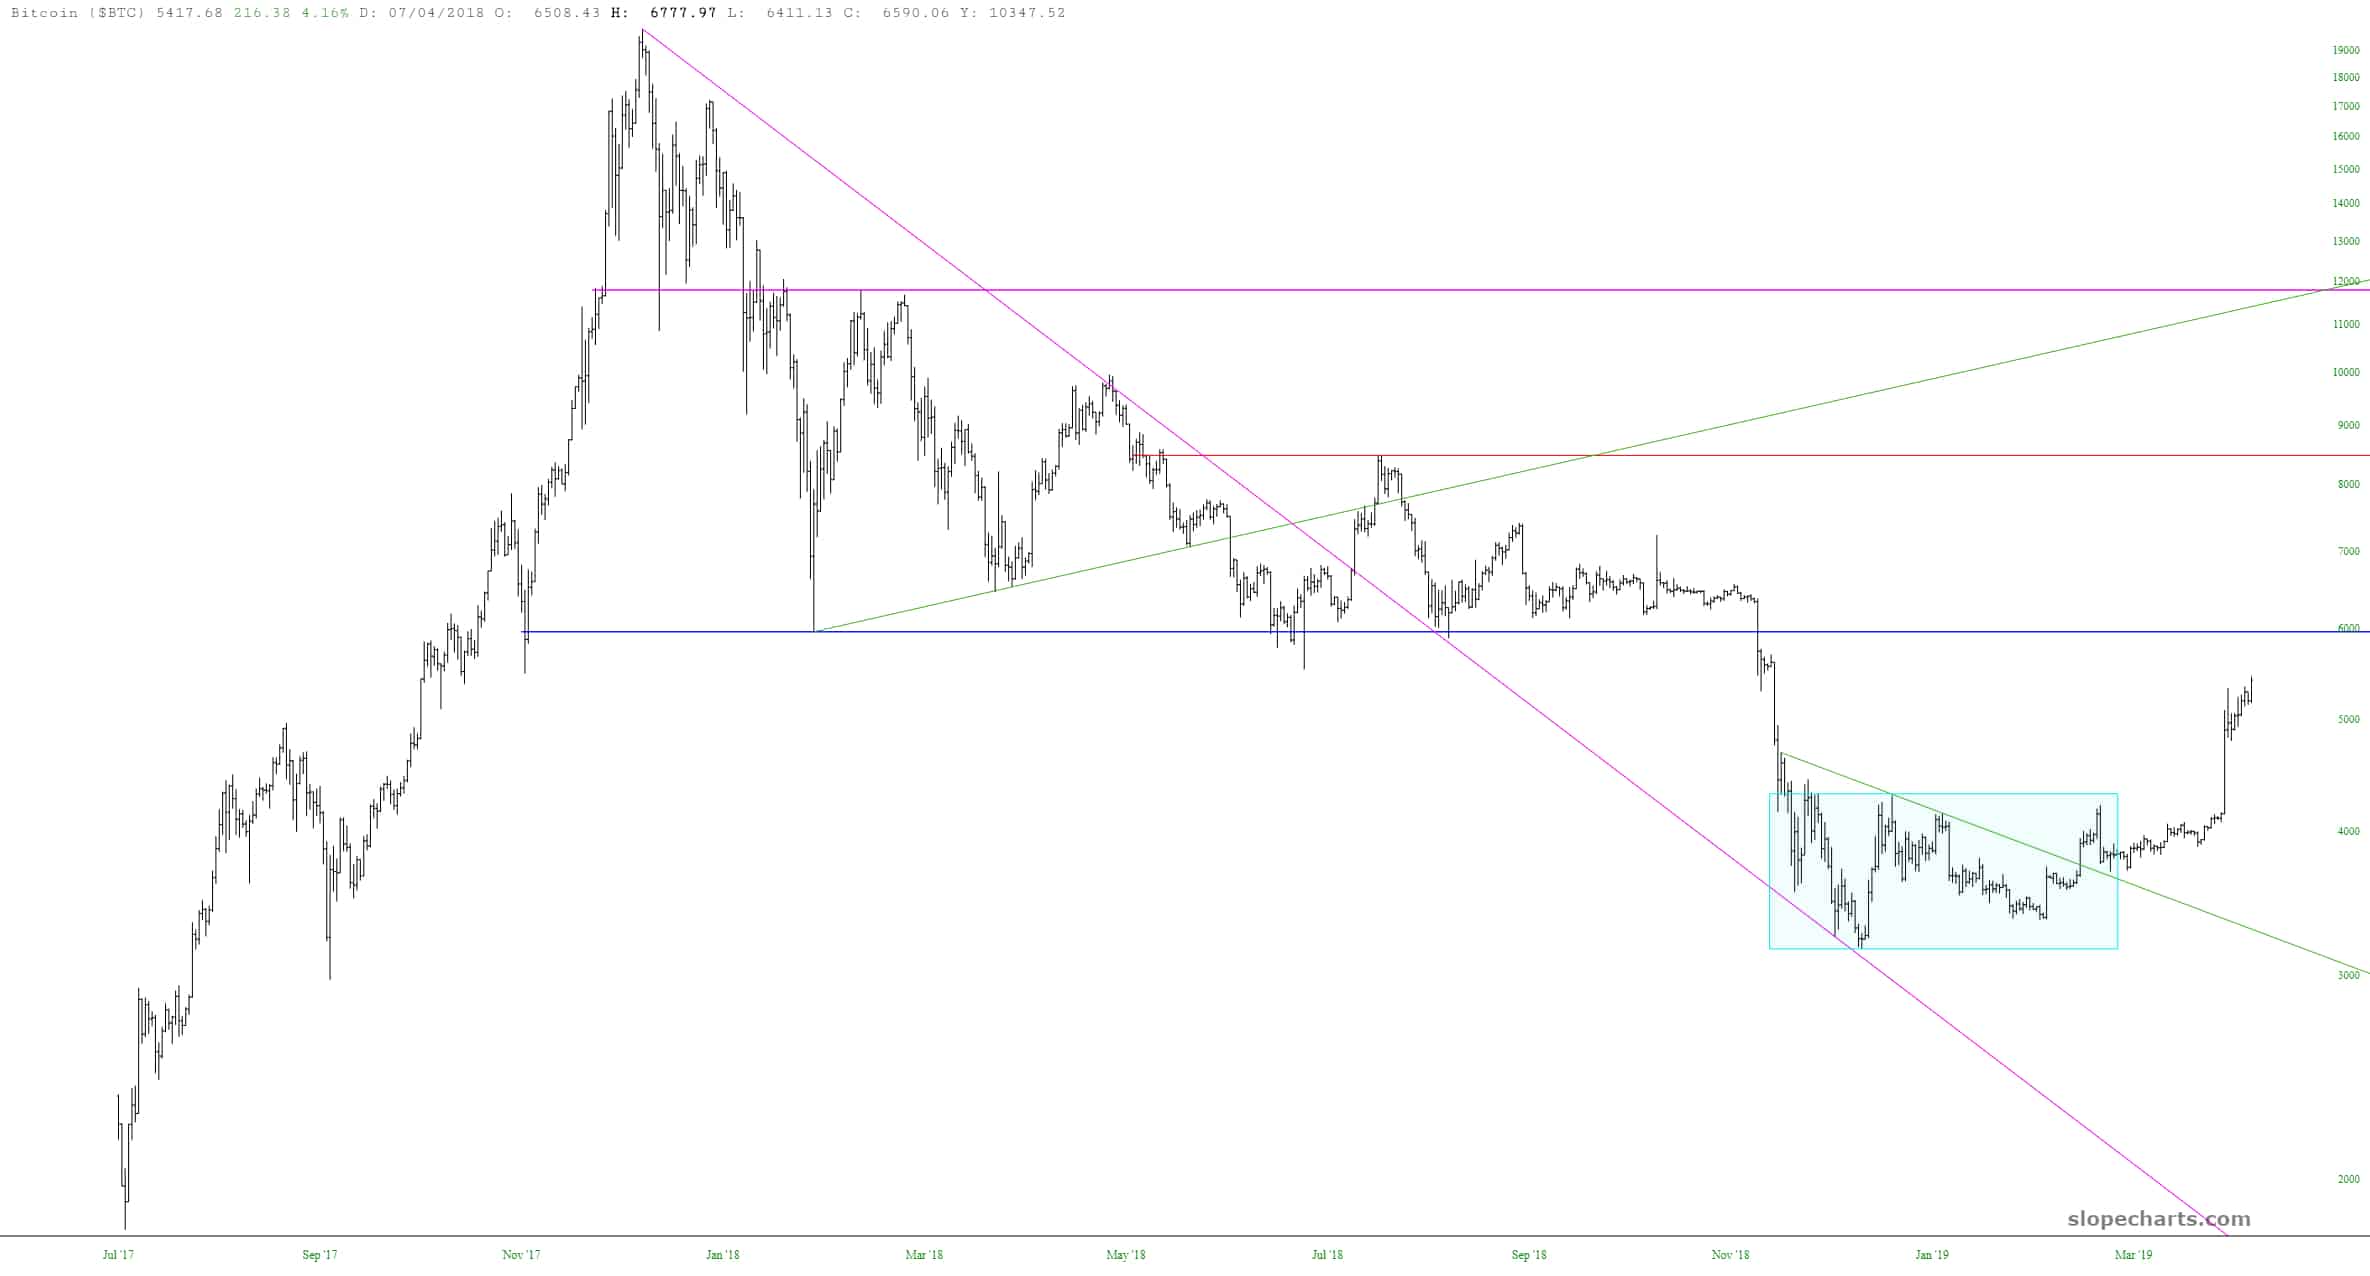
A month ago, I did a bullish post on Bitcoin (you read those two words right – – bullish and bitcoin) when it was about $3800. It’s up about 40% in just a month’s time, and I maintain that getting to $6,000 is the logical stopping point.
Slope initially began as a blog, so this is where most of the website’s content resides. Here we have tens of thousands of posts dating back over a decade. These are listed in reverse chronological order. Click on any category icon below to see posts tagged with that particular subject, or click on a word in the category cloud on the right side of the screen for more specific choices.
A month ago, I did a bullish post on Bitcoin (you read those two words right – – bullish and bitcoin) when it was about $3800. It’s up about 40% in just a month’s time, and I maintain that getting to $6,000 is the logical stopping point.
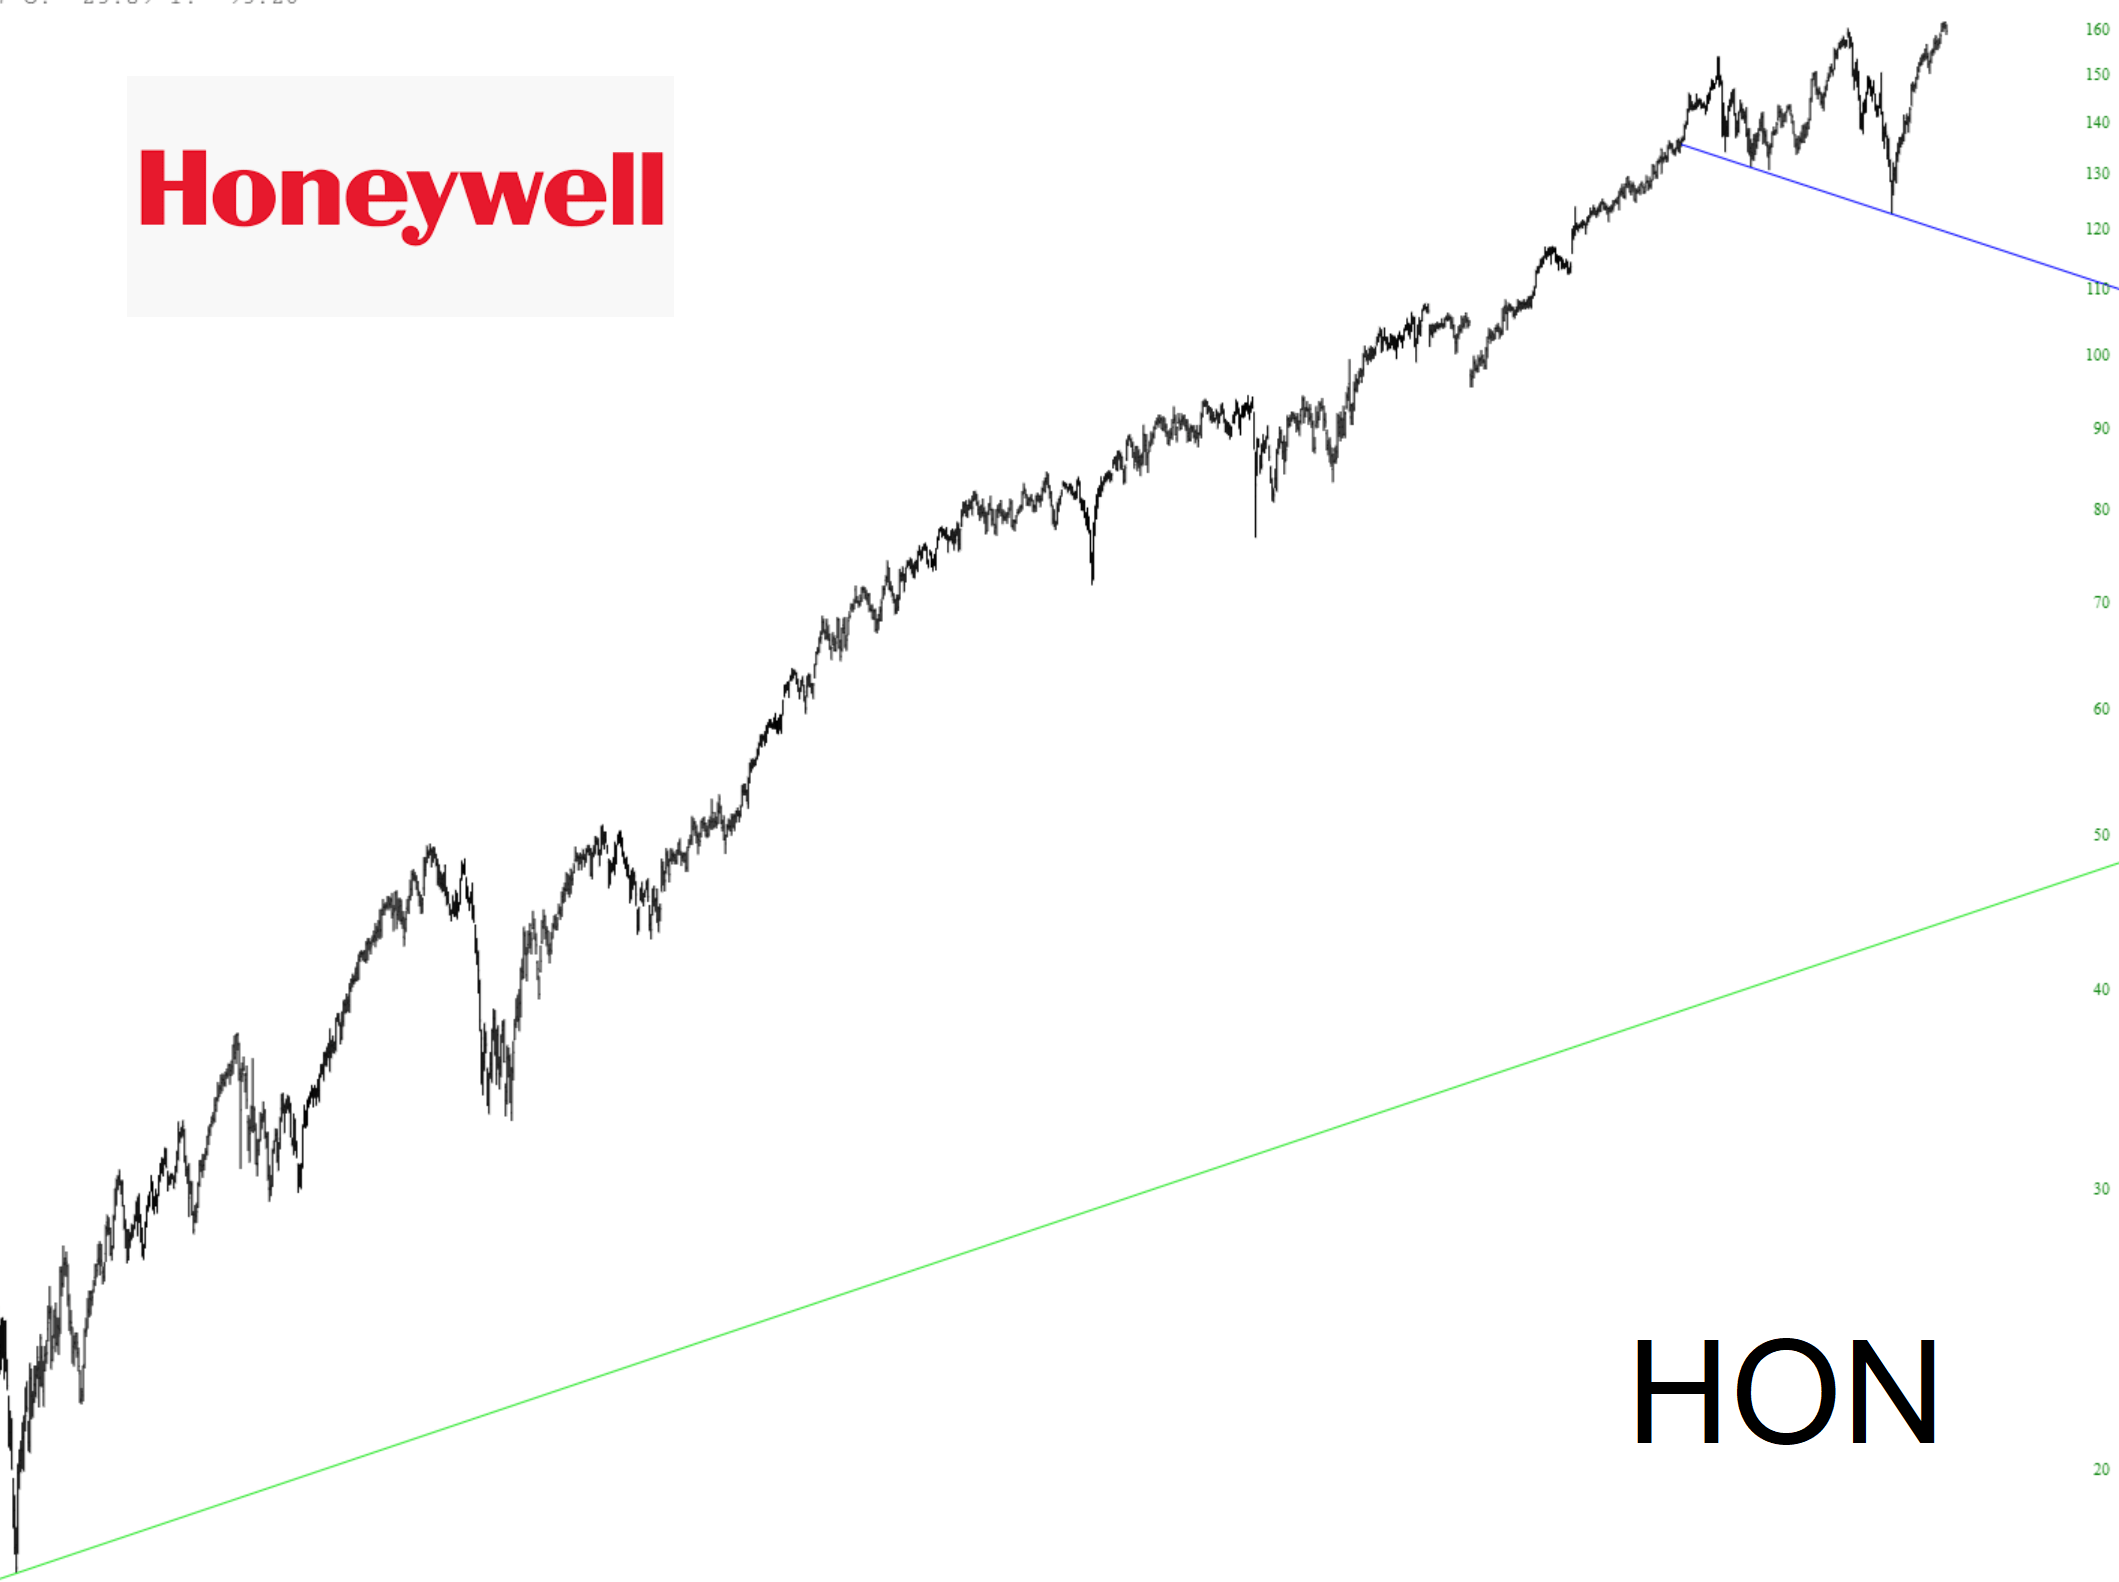
I’ll level with ya; this is one of those days when I’m absolutely struggling to come up with anything to write about. So I’ll just throw out there a chart I find mildly interesting, which is Honeywell.
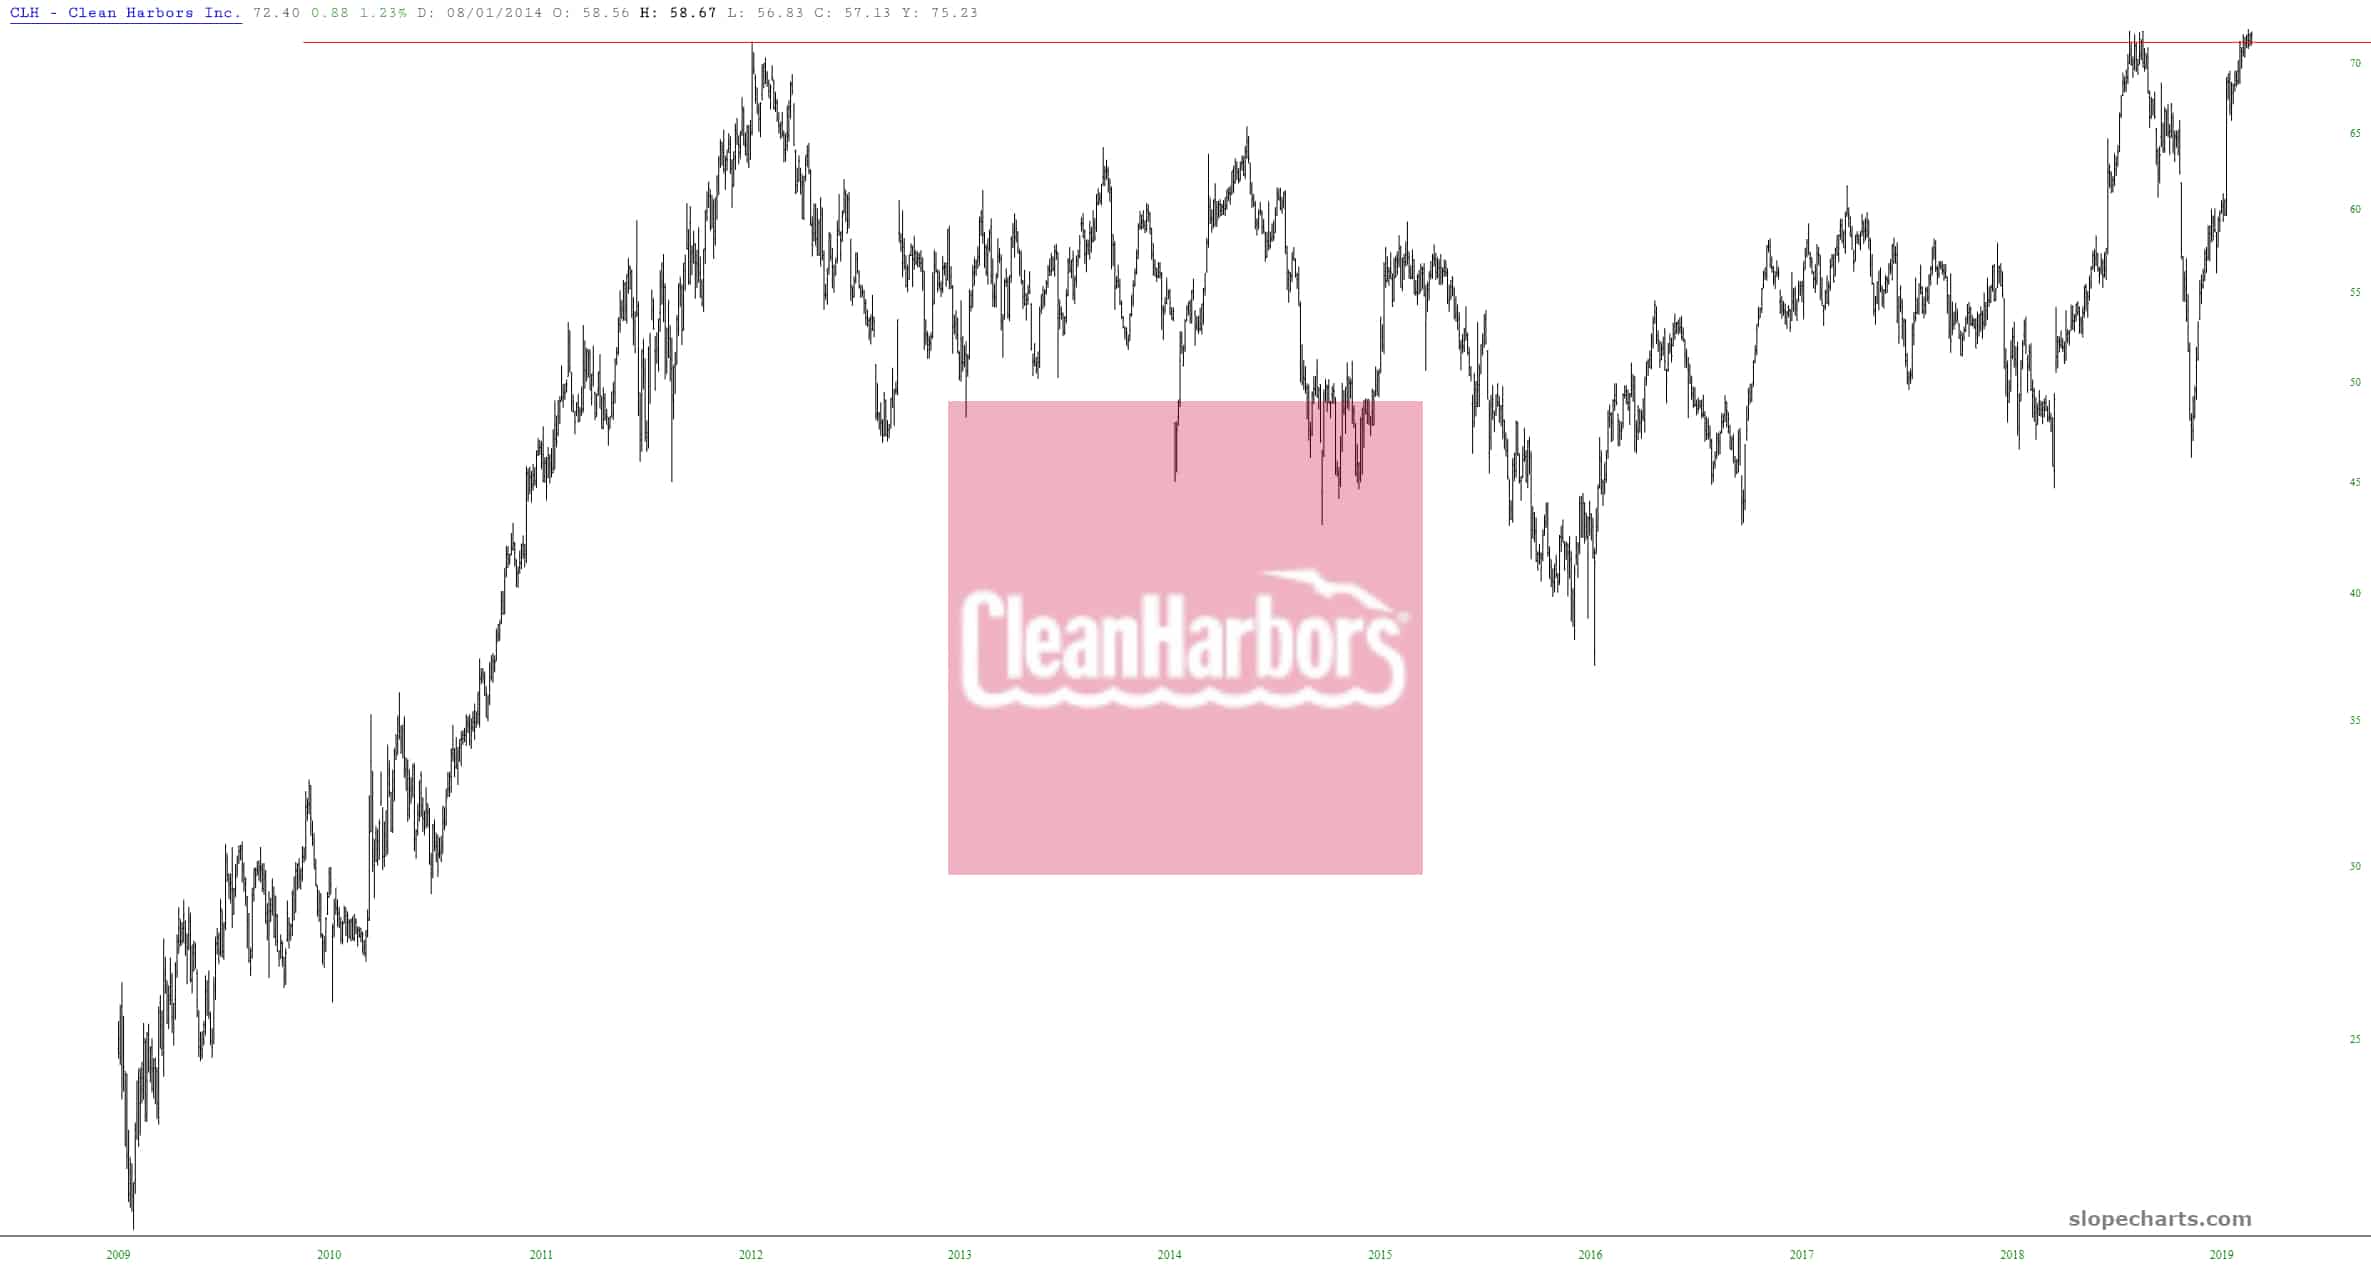
OK, it’s a pretty dull day (the S&P is up one-fifth of a single percentage point), so while we await the Fed minutes, here are a few dazzling long patterns.
I don’t make a habit of watching Cramer (by which I mean, over the course of my entire life, I’ve probably watched fewer than 5 minutes of the clown). But here’s this gem from a week ago:
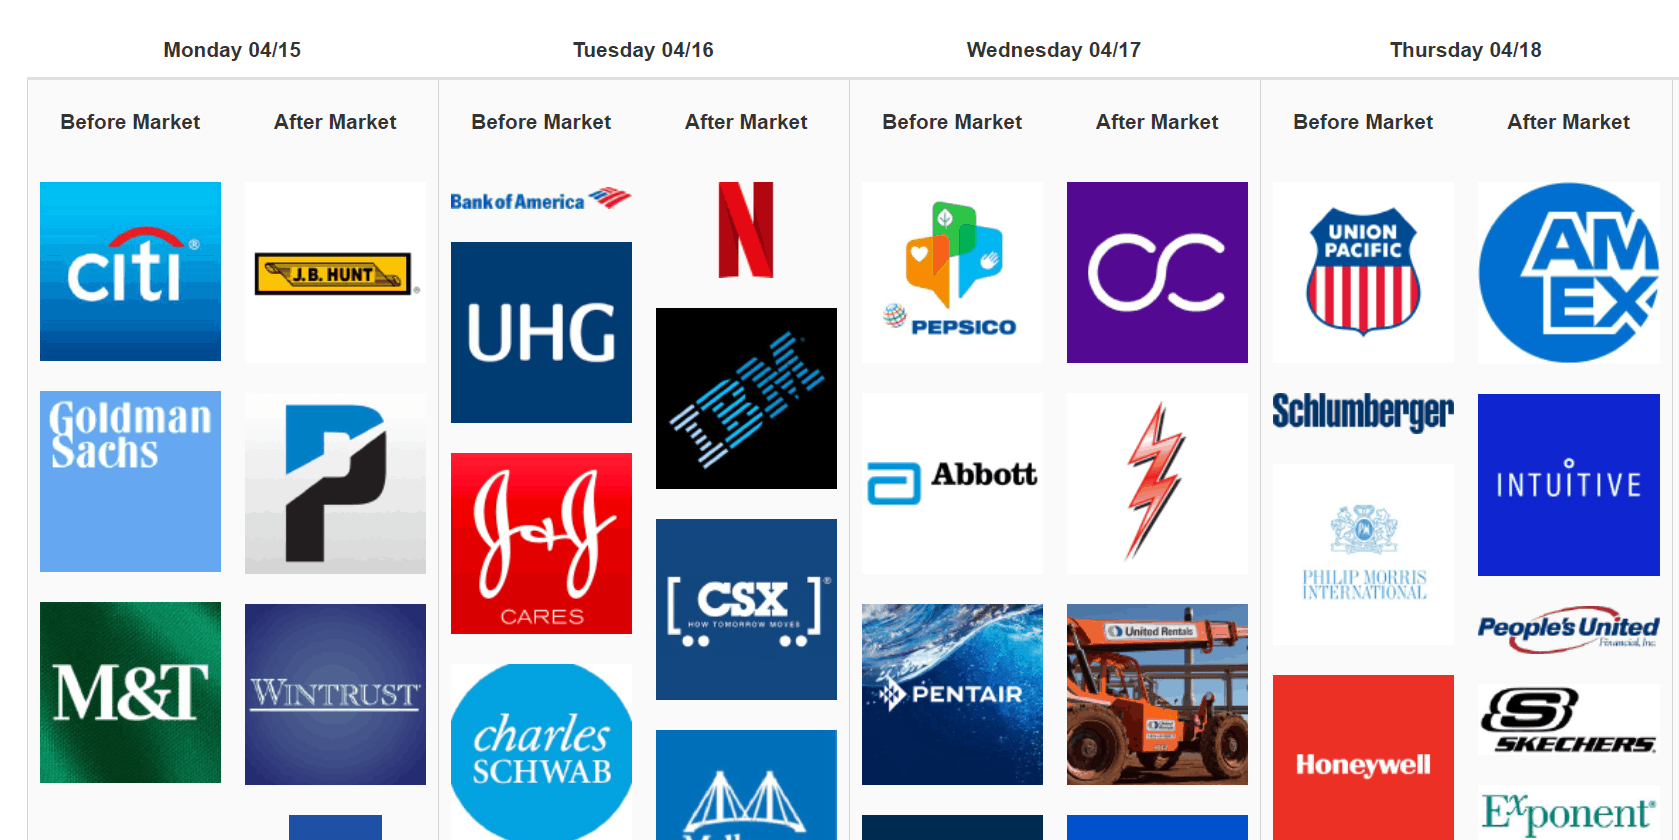
Over the past few months, we have added so many features to Slope, it’s easy to forget just how many earnings-relevant tools there are. (And this week, I’m going to roll out another one I think you’re going to love). For those newer to the site, I wanted to summarize the key earnings features.