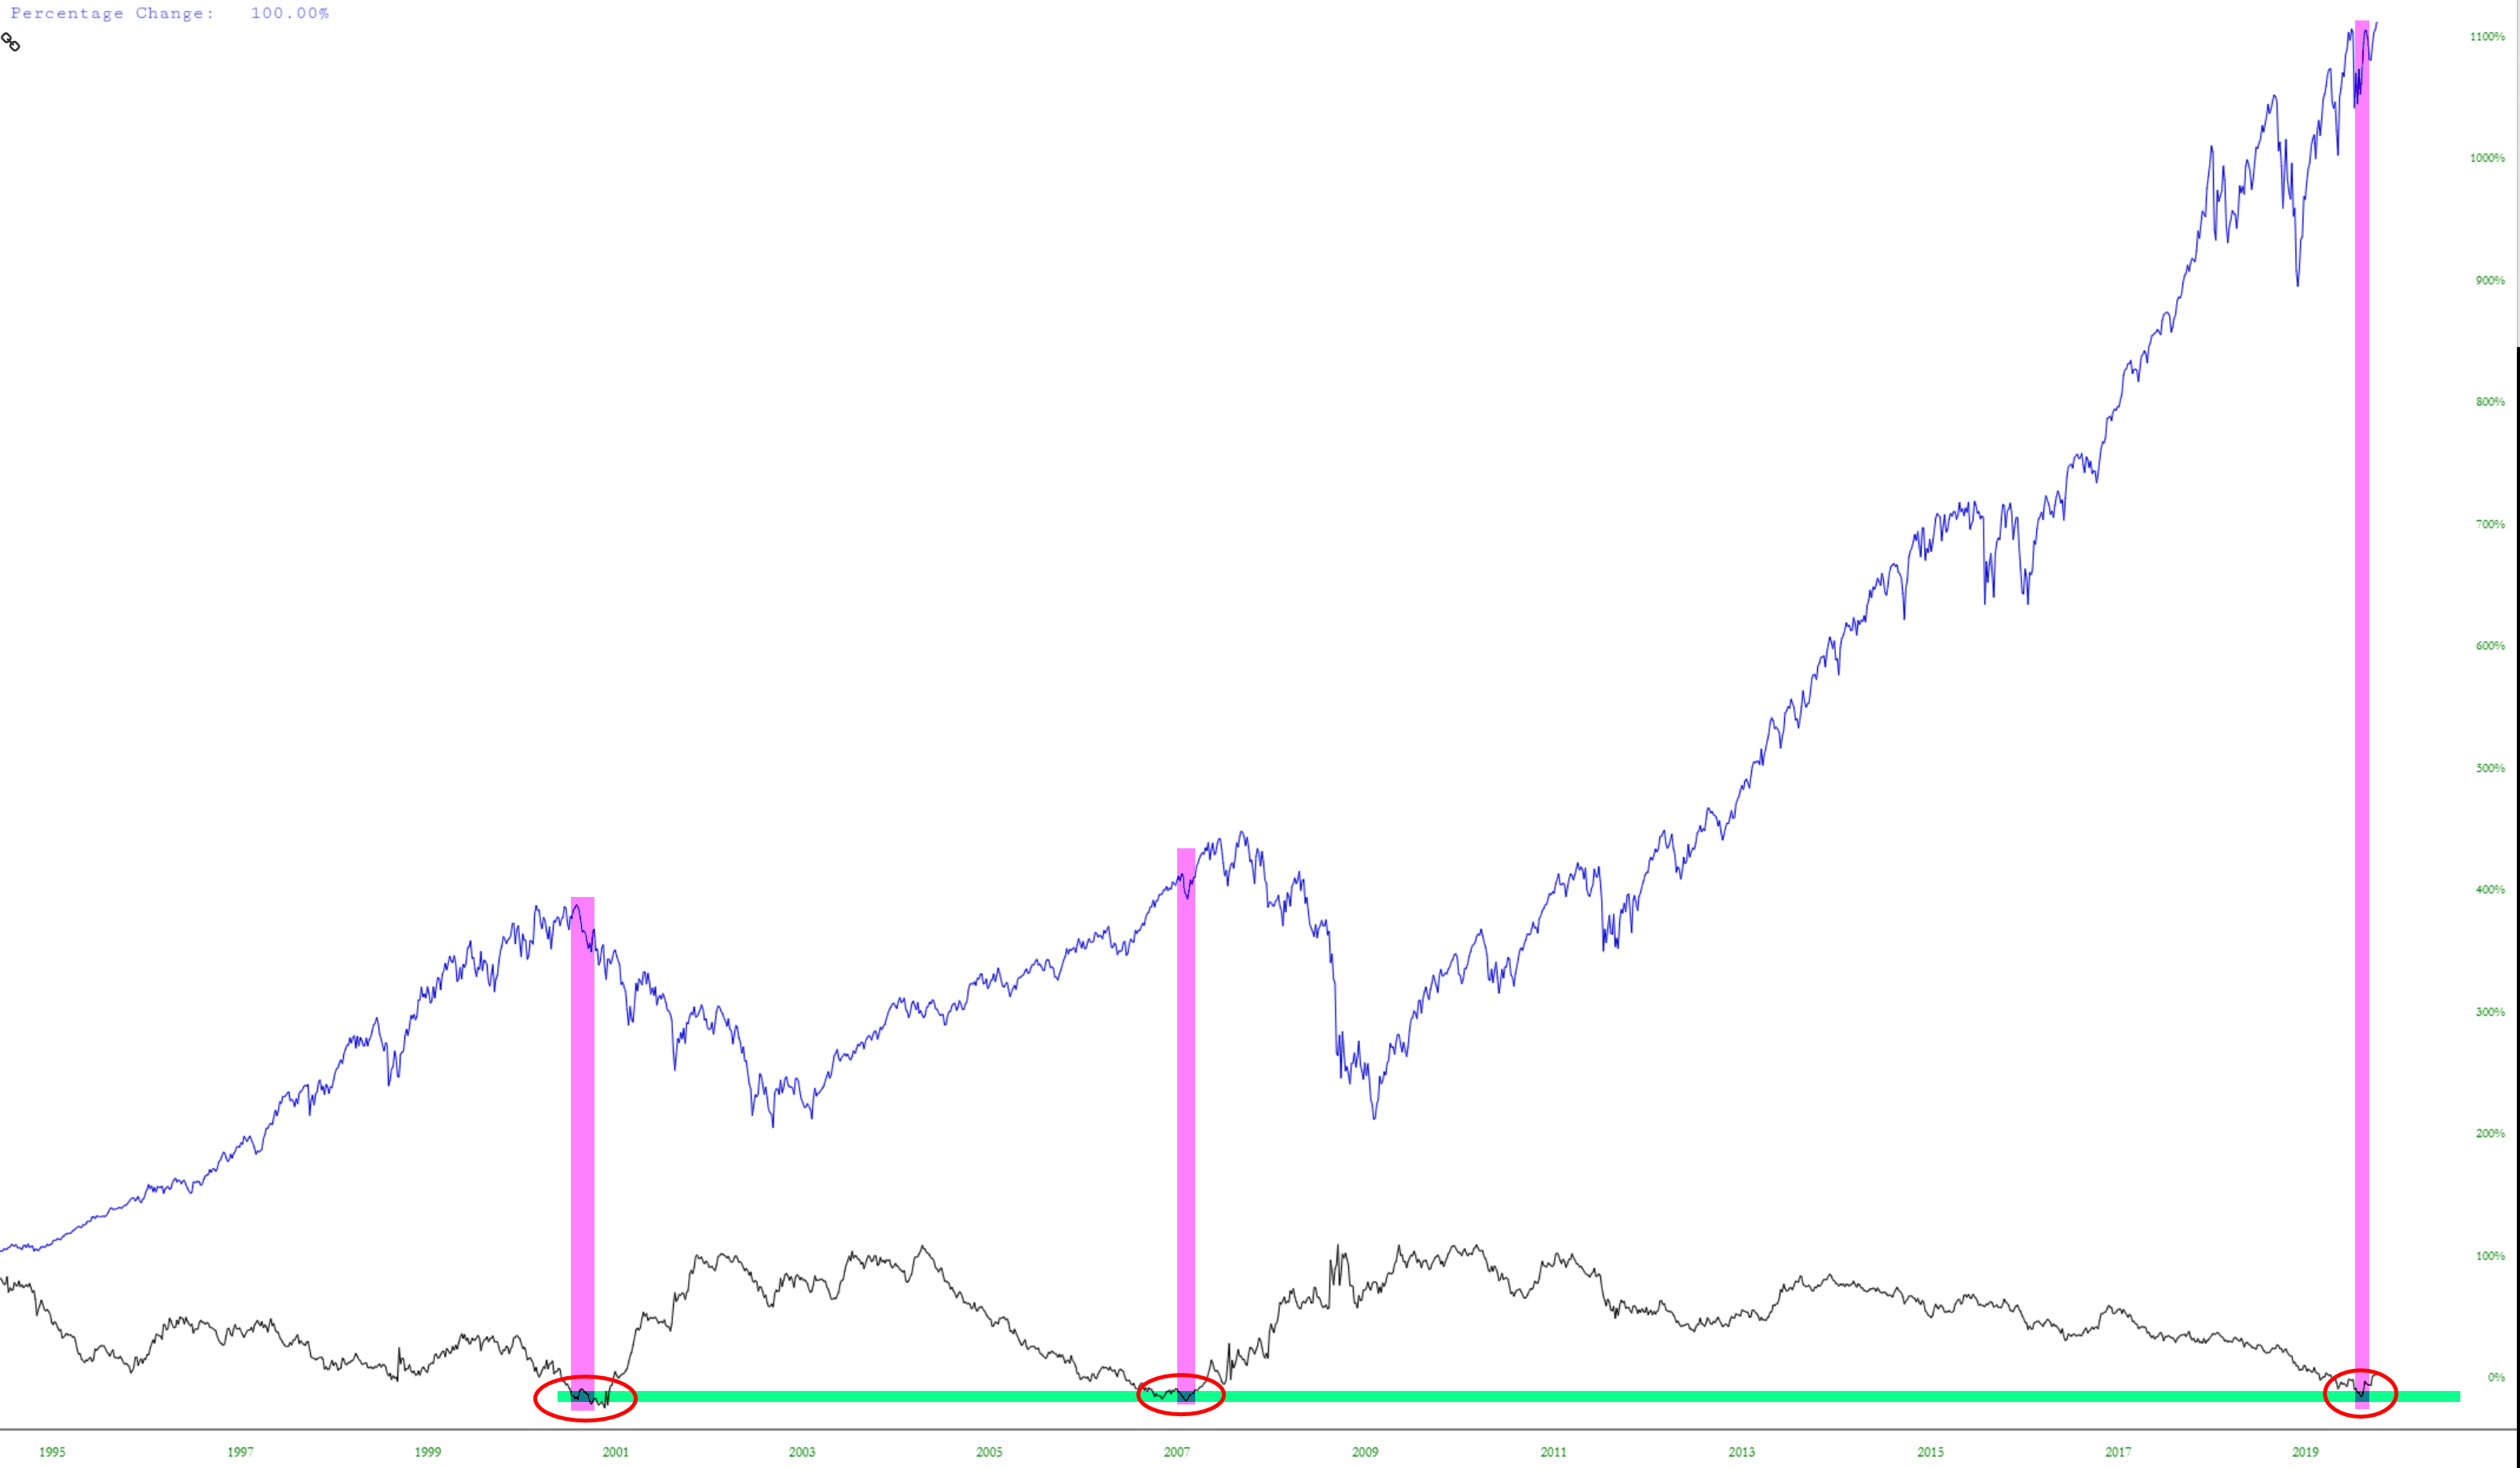
Below is an interesting chart showing, in blue, the S&P 500, and in black, the FR:T10Y2Y (10 year interest rates minus the two year). We’re only dealing with a sample size of three here, but I at least wanted to illustrate what happened in prior instances at these levels where the rate spread got to a certain depth. I’ll also point out that in 2007, it took a few months for any kind of bear market to take hold, even after the signal (if it IS a signal):