Just a reminder before I get started that we are running our July 4th sale at theartofchart.net at the moment and that will be running until the end of next week. For the duration of the sale annual memberships are available for the price of only eight months at the monthly rate rather than the usual ten and as ever with all our memberships, the membership rate will remain the same with no price rises for as long as the subscription is maintained. If you are interested then you can find the sale page here.On to the markets. I was writing last week about the Janus (Bull) Flag targets at retests of the June highs on SPX, NDX, RTY and INDU and I was noting that NDX would likely reach that target first (done) and would then likely retest a major resistance trendline just above there afterwards (retested) and that the upswing on equities might fail there (possibly happening). Here is that updated NDX weekly chart. NDX weekly chart:
(more…)Slope of Hope Blog Posts
Slope initially began as a blog, so this is where most of the website’s content resides. Here we have tens of thousands of posts dating back over a decade. These are listed in reverse chronological order. Click on any category icon below to see posts tagged with that particular subject, or click on a word in the category cloud on the right side of the screen for more specific choices.
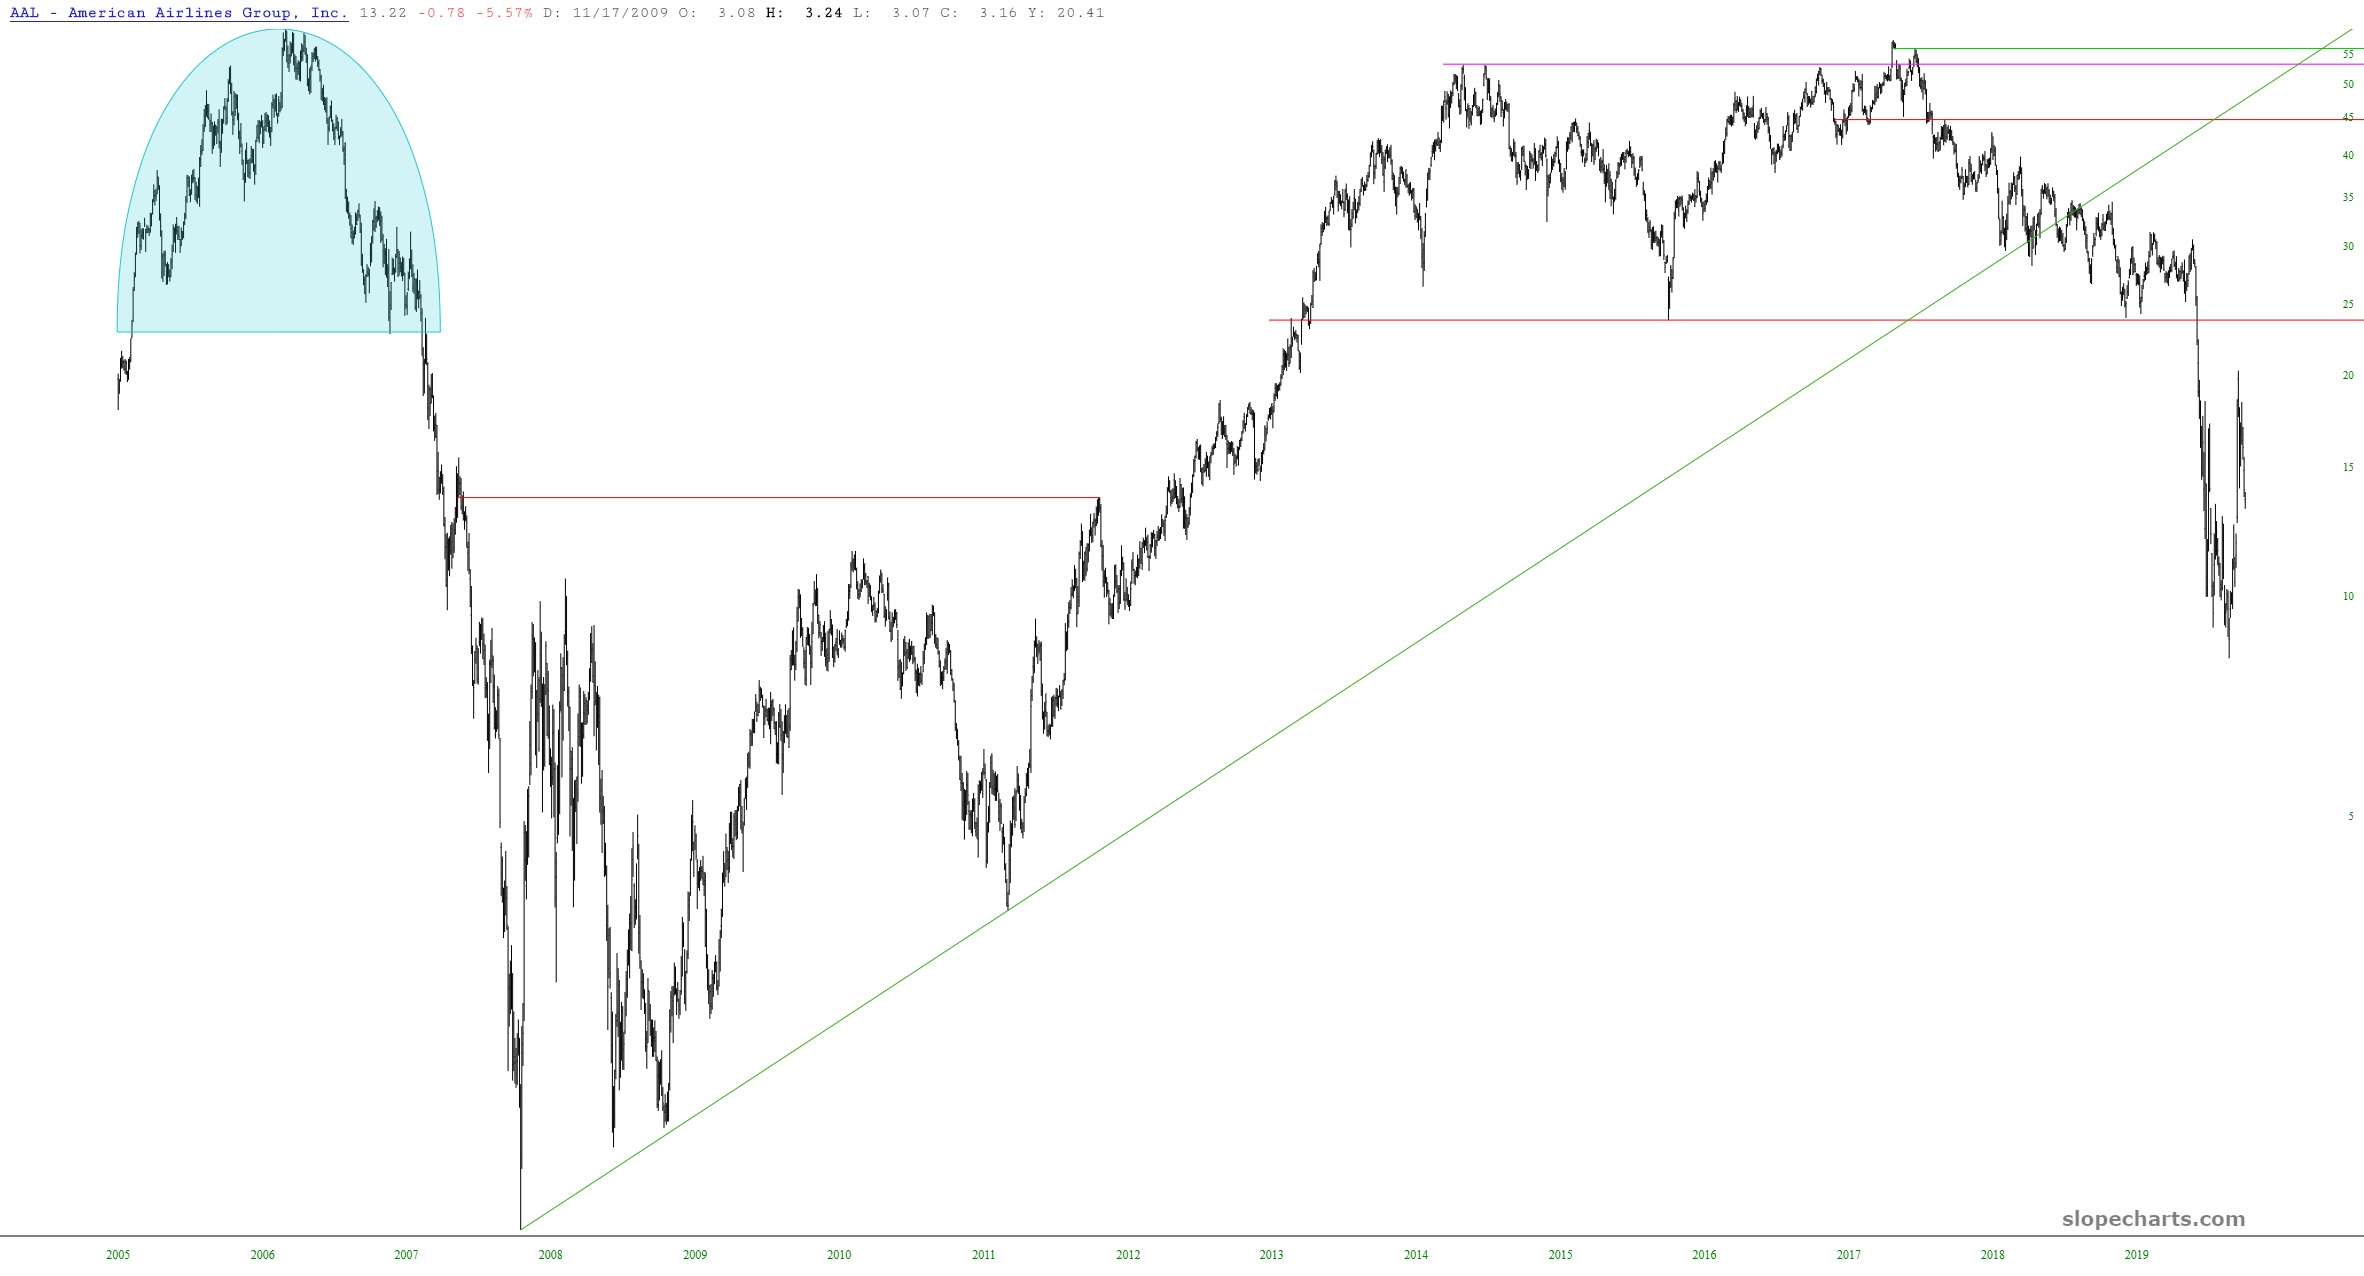
Terminal Stall
For some insane reason, people thought airlines would be great stocks to chase. Ummm, why? No one is flying. No one’s going to fly. Travel is going to be dead for years. It’s easy to see that people are stark, raving mad. The new plunge has resumed for airline stocks. Sheesh.
Not Even the Tip
I saw this remark only yesterday:

Huh? Oil did a gorgeous job falling away from the price gap.
(more…)Long Death
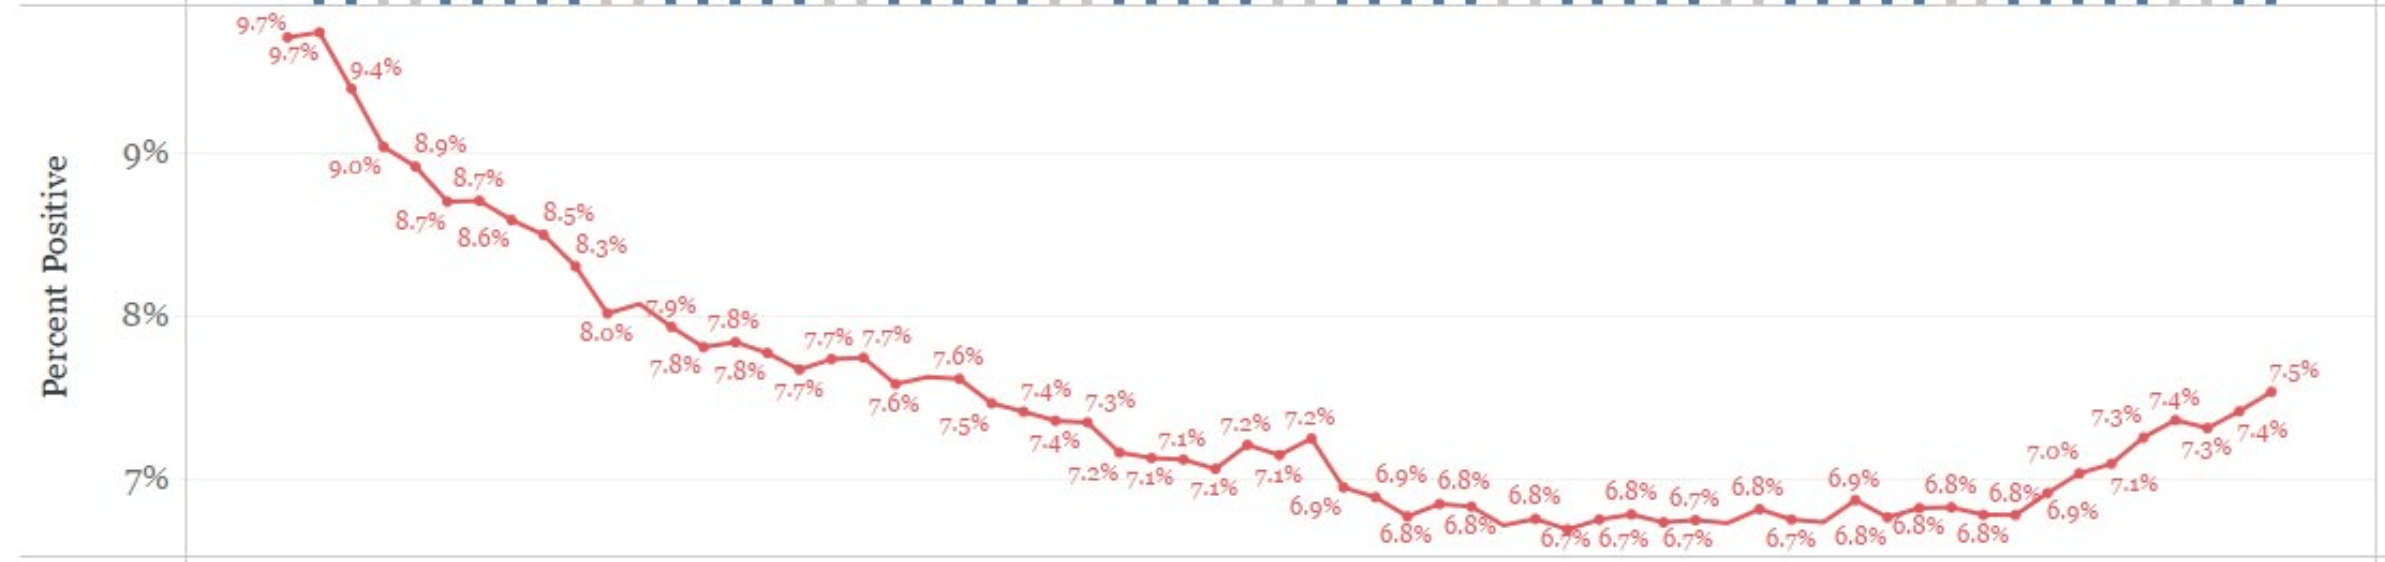
I know, I know. Some of you will say it’s just because of more testing. Whatever. Anyway, here are some charts.