
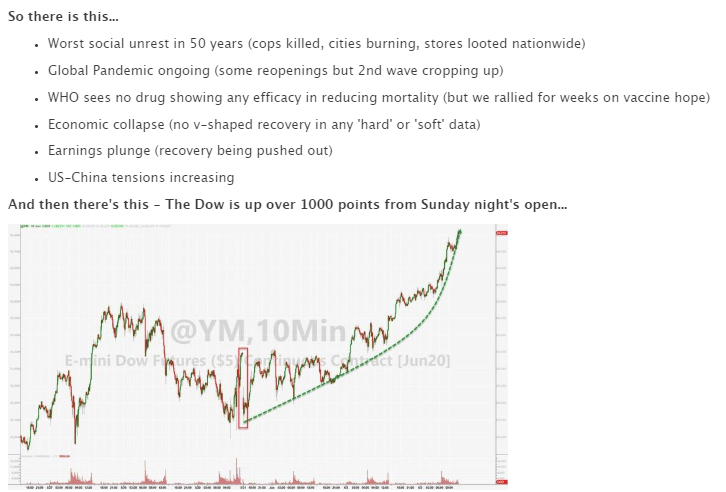
ZeroHedge put it just as well as I could………
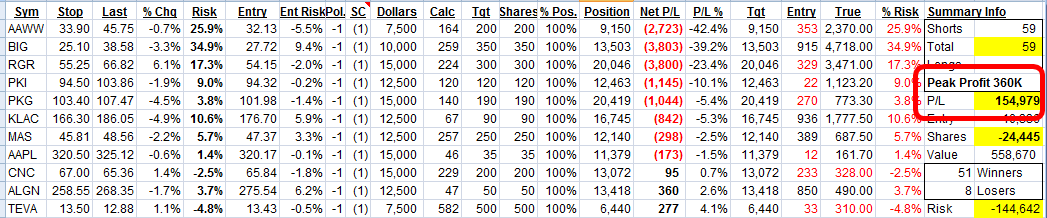
I thought it would be a good time to check in with my “Devil May Care” spreadsheets that I set up as described in my May 26th post. Here is the hypothetical $500,000 portfolio spread among 125 equal short positions:

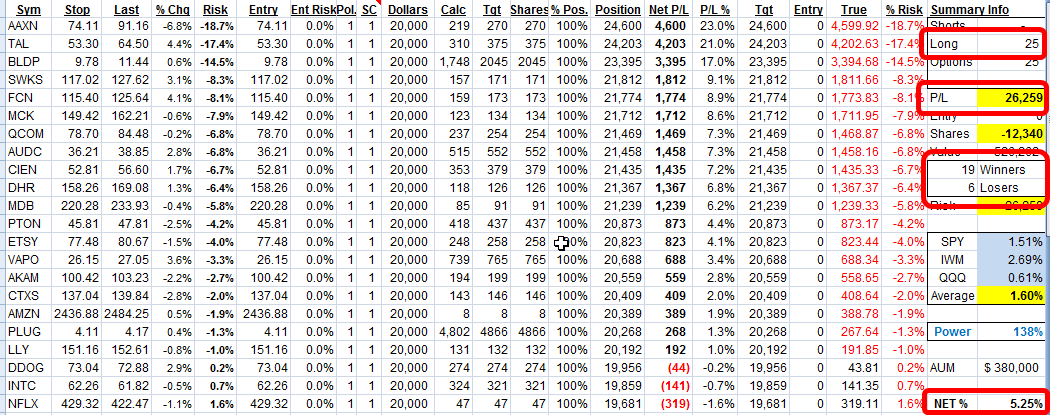
In contrast, here’s the $500,000 portfolio evenly spread among 25 long positions:
Now here’s where it gets interesting, which is precisely why I set this stuff up in the first place. I wanted to see how these two very different universes of portfolio members behaved themselves. So in the short portfolio:
- 125 positions
- $57,000 loss
- 6 winners, 119 losers (!)
- Net change of -11.38%
And in the long portfolio:
- 25 positions
- $26,000 loss
- 19 winners, 6 losers
- Net change of +5.25%
So, two equally sized portfolios, evenly spread among all their components, and the short one is getting killed at twice the rate that the long one is prospering. Incredible!
That quite convincingly shows me how much of a ‘short squeeze” rally is going on here. Both of these spreadsheets have a wide diversity of sectors, yet while the long one is just ambling higher with the market in general, the short positions are getting nuked. Indeed, the SPY is up 5.6% in the same timeframe, which means there is virtually no value added with the carefully-chosen long positions.
Paradoxically, over this brief timespan, the best move would have been to actually buy all the bearish-looking charts. (The reason being, I think, because these are the most tantalizing setups on the short side, and they have been squeezing the ever-loving life out of the bears trying to hold those positions). To me, these results are fairly extraordinary. A more than 100% difference in the span of just days.
On a totally different note, I have yet another spreadsheet called Virus Cover which is much older. It basically consists of all the short positions I created in January and early February. Even after I covered all those positions, I still tracked how it did, and the profit peaked at $360,000, as I noted in the spreadsheet. What’s interesting to me is now that “if I just held on to this day” profit has been battered and smashed down to about $154,000. Thus, only about 40% of those “peak bear profits” have survived (which is pretty amazing, since bearish instruments like TWM and HDGE are at lifetime lows and retained absolutely none of their profits).
The arrogance of the bulls is absolutely off the charts. This is the kind of learned discourse being served up:

And, even better, this:

The sad part is that, to date, this numbskull is absolutely right! Because even over the course of the last 10 weeks, the last four days have been jaw-dropping in terms of their ability to simply explode higher every single day with absolutely no good reason whatesoever.
As for myself, my own portfolio gets lighter and lighter by the way, until it’s just about to float away. I have a mere 23 equity positions (all tiny) and, opened fresh on Wednesday, two small put positions (IWM and QQQ, both July monthly expirations).
