
Another week, another unemployment claims report. It is settling down, of course, because they’re running out of people to unemploy. We’re almost at the 50 million mark. Which, of course, explains why we’re 1% beneath the highest point in human history on the NASDAQ.
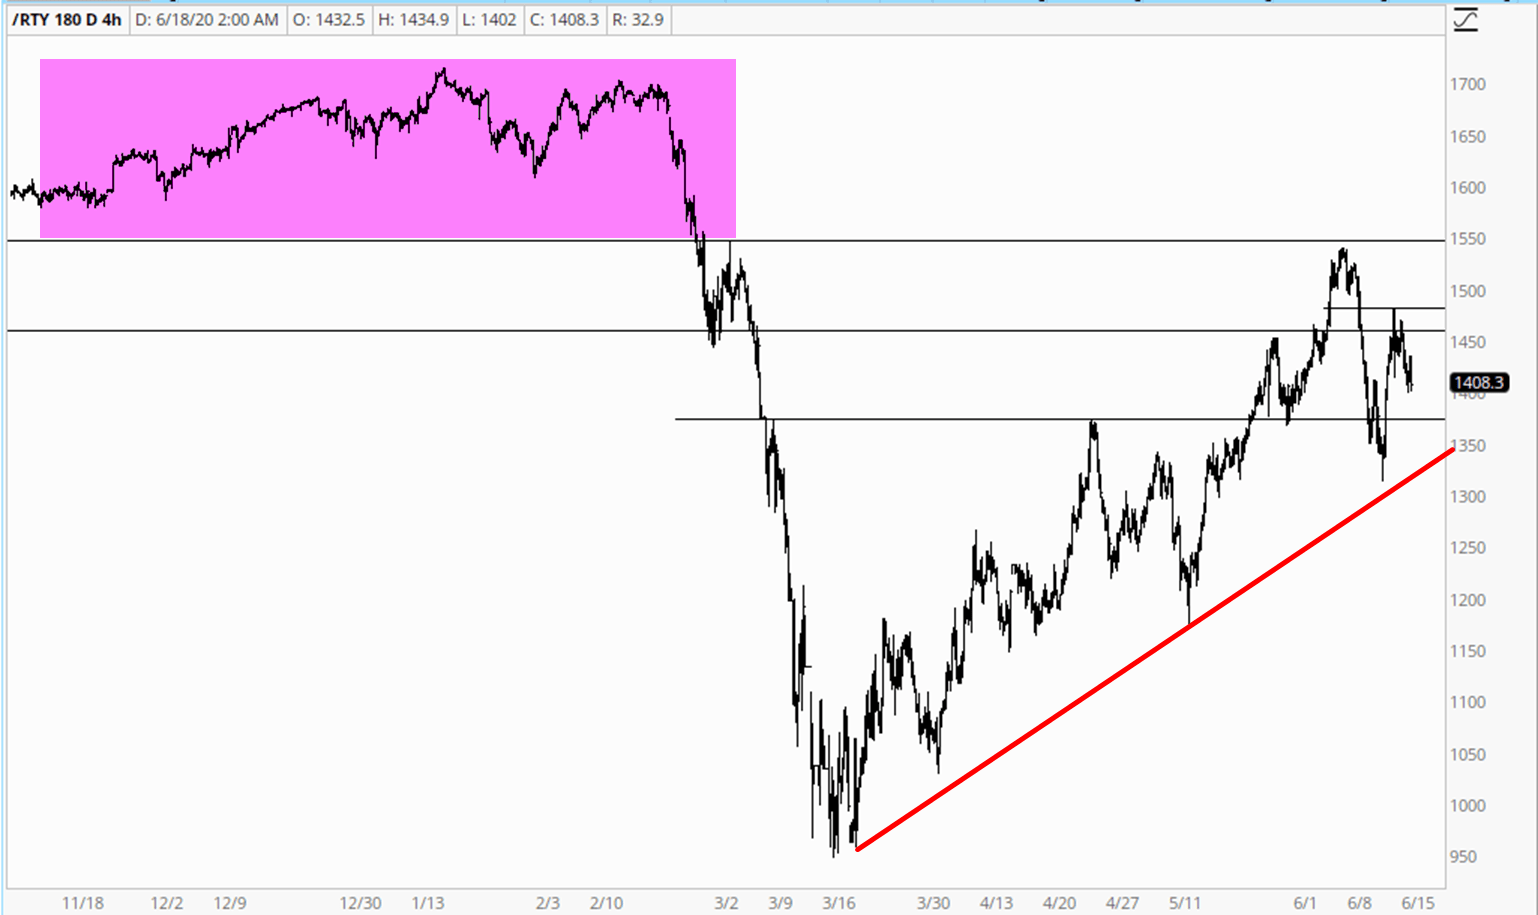
It was nice to wake up to red this morning, but until the intermediate-term trendline on the Russell (shown below by way of the /RTY) is broken, it’s all just little wiggles and squiggles.
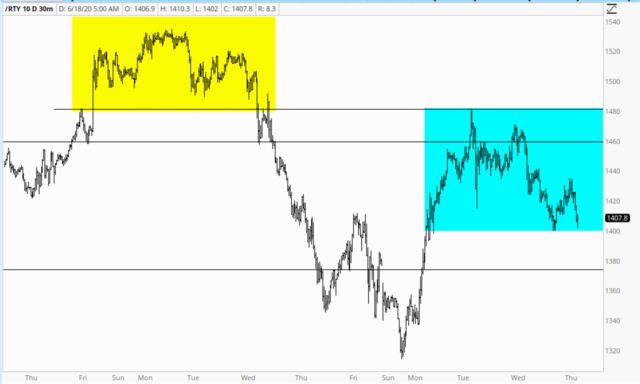
Looking closer, we can see the well-formed topping pattern last week (in yellow) and, at the moment, another not-as-clean pattern in formation. I suspect you can guess which way I’d like to see this break.
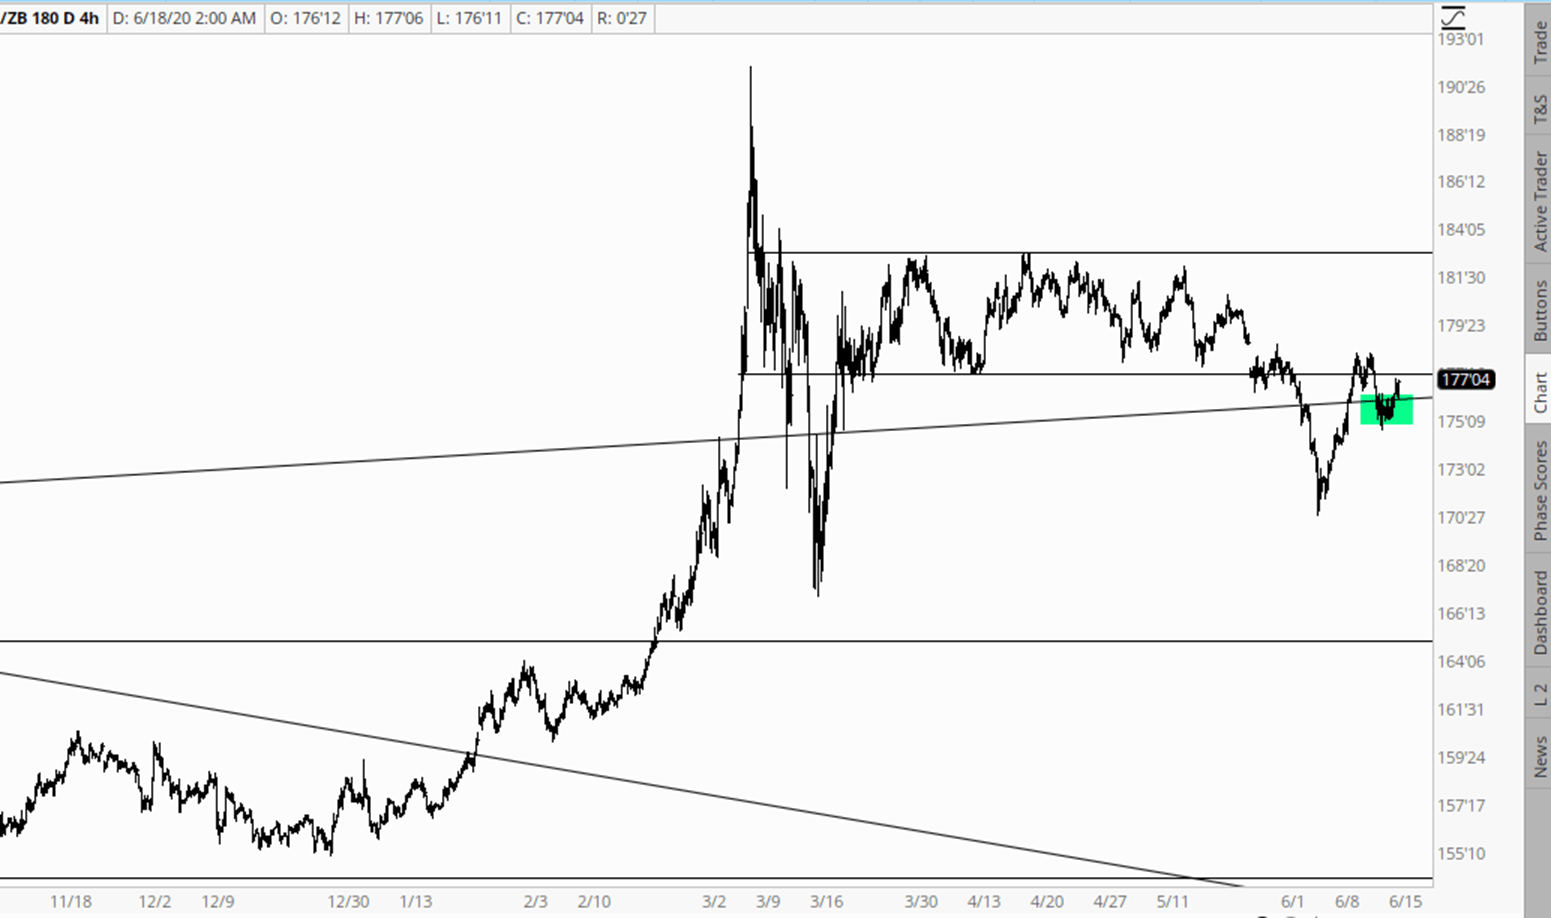
One adjunct market worth noting is bonds (/ZB) which has been strengthening the past few days (green tint). I would caution, though, that we seemed to be working our way toward a breakout before (yellow) but that flopped.
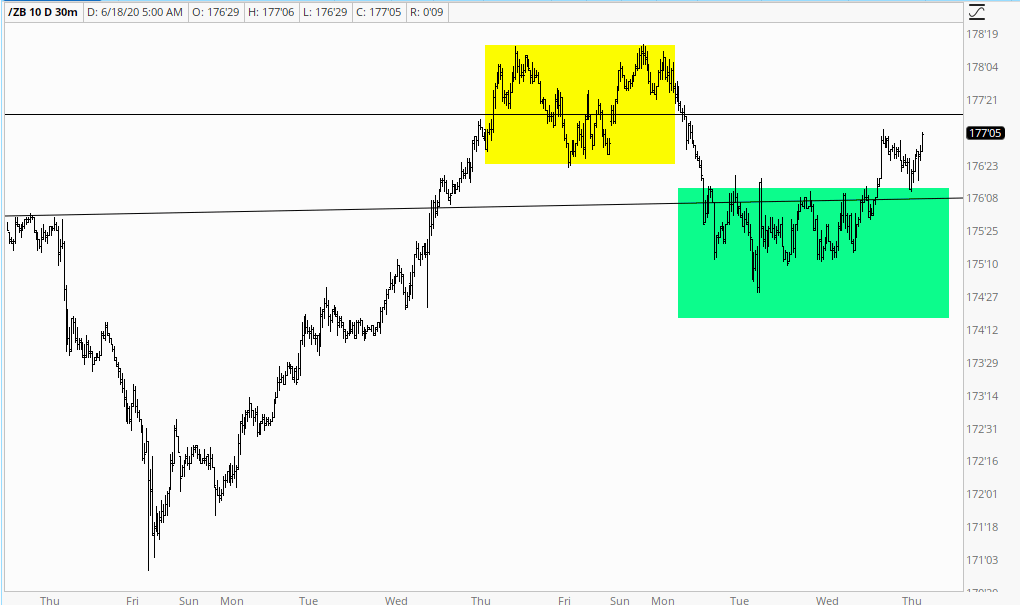
It’s all a matter of perspective, however. That clean saucer pattern tinted above in green is likewise tinted below on a longer time-scale, and as is plain to see, it’s pretty small. I will note, however, that if we can push above the levels we were seeing Monday morning (illustrated above in the yellow tint), the bull market in bonds could re-appear, which of course would help the bearish case.
As we enter the day, I have 60 short positions and a commitment level of 123%. Hang in there, folks!
