One thing I try to stress in these posts is that the movement of the market can, to a significant extent, be broken down into a series of inflection points and, depending on the outcomes at those inflection points, the market moves to the next inflection point or screen.
Last week there was a very nicely formed inflection point and the decision at that inflection point was made on Friday, with a smaller bull flag channel ultimately breaking up with a target at a retest of the short term high at 3184.15, and a larger bull flag channel also breaking up with a target at a retest of the June high at 3233.13. Both targets have now been reached, with the high today on SPX at a marginal higher high at 3235.32.
Was this good news for bulls? Well not necessarily no, as my bear scenario had a decline ideally into the 2880 area before a likely retest of the June high to set up a possible double top for this move up since the March low. As that retest has been done now instead, that possible double top has been set up earlier and SPX has arrived at this next inflection point.
How decent is the pattern setup here? Well pretty good actually, at least to set the ball rolling to the downside. There’s a decent RSI 14 sell signal on the SPX 15min chart and a small H&S there that has broken down with a target in the 3165 area, close to current rising wedge support now in the 3157 area.
SPX 15min chart:
On the SPX hourly chart there is already a previously fixed RSI 14 sell signal that is still valid, and I have sketched on the possible double top setup that may now be in play. A sustained break below the 2965 low would look for the 2595 area.
SPX 60min chart:
On ES another hourly RSI 14 sell signal has also fixed after the high today with a small H&S that has broken down with a target in the 3154 area, close to the next decent support level and the weekly pivot at 3156. A break and conversion of 3156 would open another retest of main current support at the daily middle band.
ES Sep 60min chart:
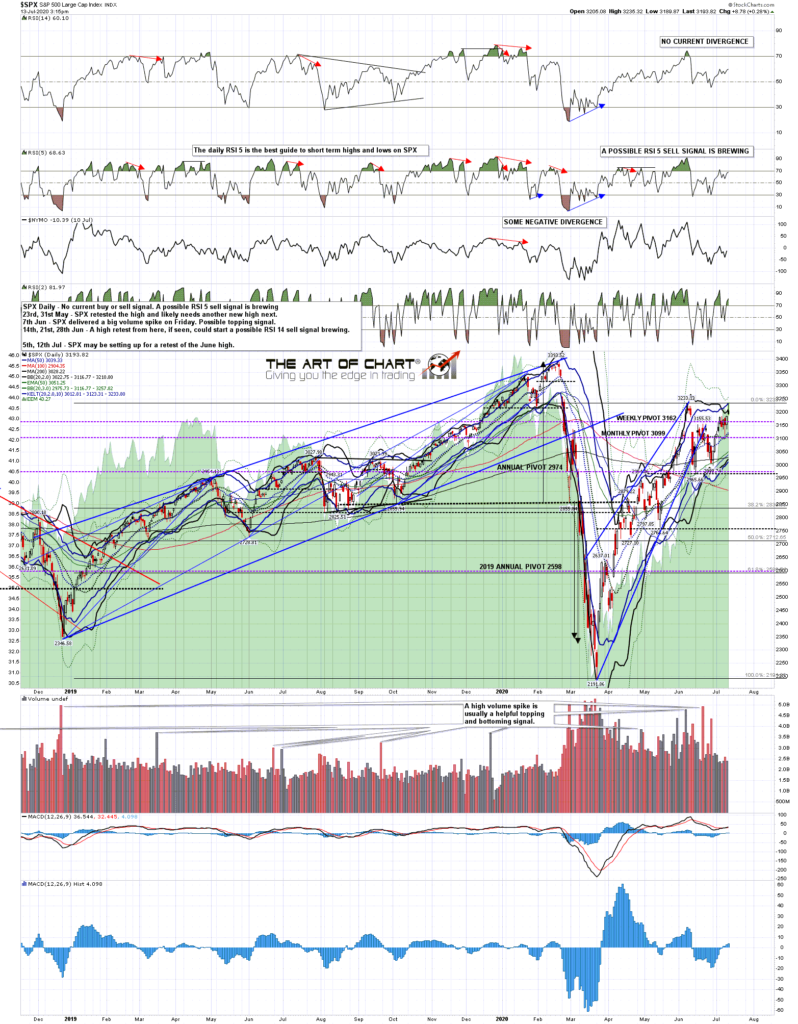
If the daily middle band can be broken and converted to resistance then that would be a serious support break and the large double top setup here would be in play, subject to successful breaks and conversions of the 50dma (currently 3039) and the 200dma (currently 3028). I’d note that a possible daily RSI 5 sell signal is now also brewing. Let’s see how this develops. 🙂
SPX daily chart:
A couple of things to mention today. We are running another Traders Boot Camp at theartofchart.net starting on 3rd August teaching technical analysis and trading skills. These are mainly aimed at existing subscribers but are open to all and are comprehensive, include a lot of useful trading tools, and very cheap relative to an equivalent courses that I have seen online. If you are interested you can read more about that here.
The last thing to mention is that our Paragon Options Service trading options on futures and ETFs is up about 82% so far this year and has just closed a sixth green trade in a row. If you’re interested we offer a 30 day free trial and you can read more about that here.
I’m planning two special posts over the next few days, one looking at the next year or two under the shadow of COVID-19 and the other looking at the progress of the tech bubble this year and the gap that has been increasing between tech stocks and other stocks in US markets.


