
I was saying in my last post on Monday that a retest of the high looked likely and we saw new all time highs on both SPX and NDX as expected. So what now?
Well the best pattern on the board on Monday was the rising wedge on the Dow, and that is still looking pretty good. A daily RSI 5 sell signal has fixed there already of course, as one has on SPX as well.
INDU 60min chart:

However that rising wedge on Dow is no longer the best pattern on the board as a simply beautiful rising wedge was established on SPX at the high this morning. A possible hourly RSI 14 sell signal is now brewing (also on NDX) and an hourly RSI 5 sell signal has fixed.
SPX 60min chart:
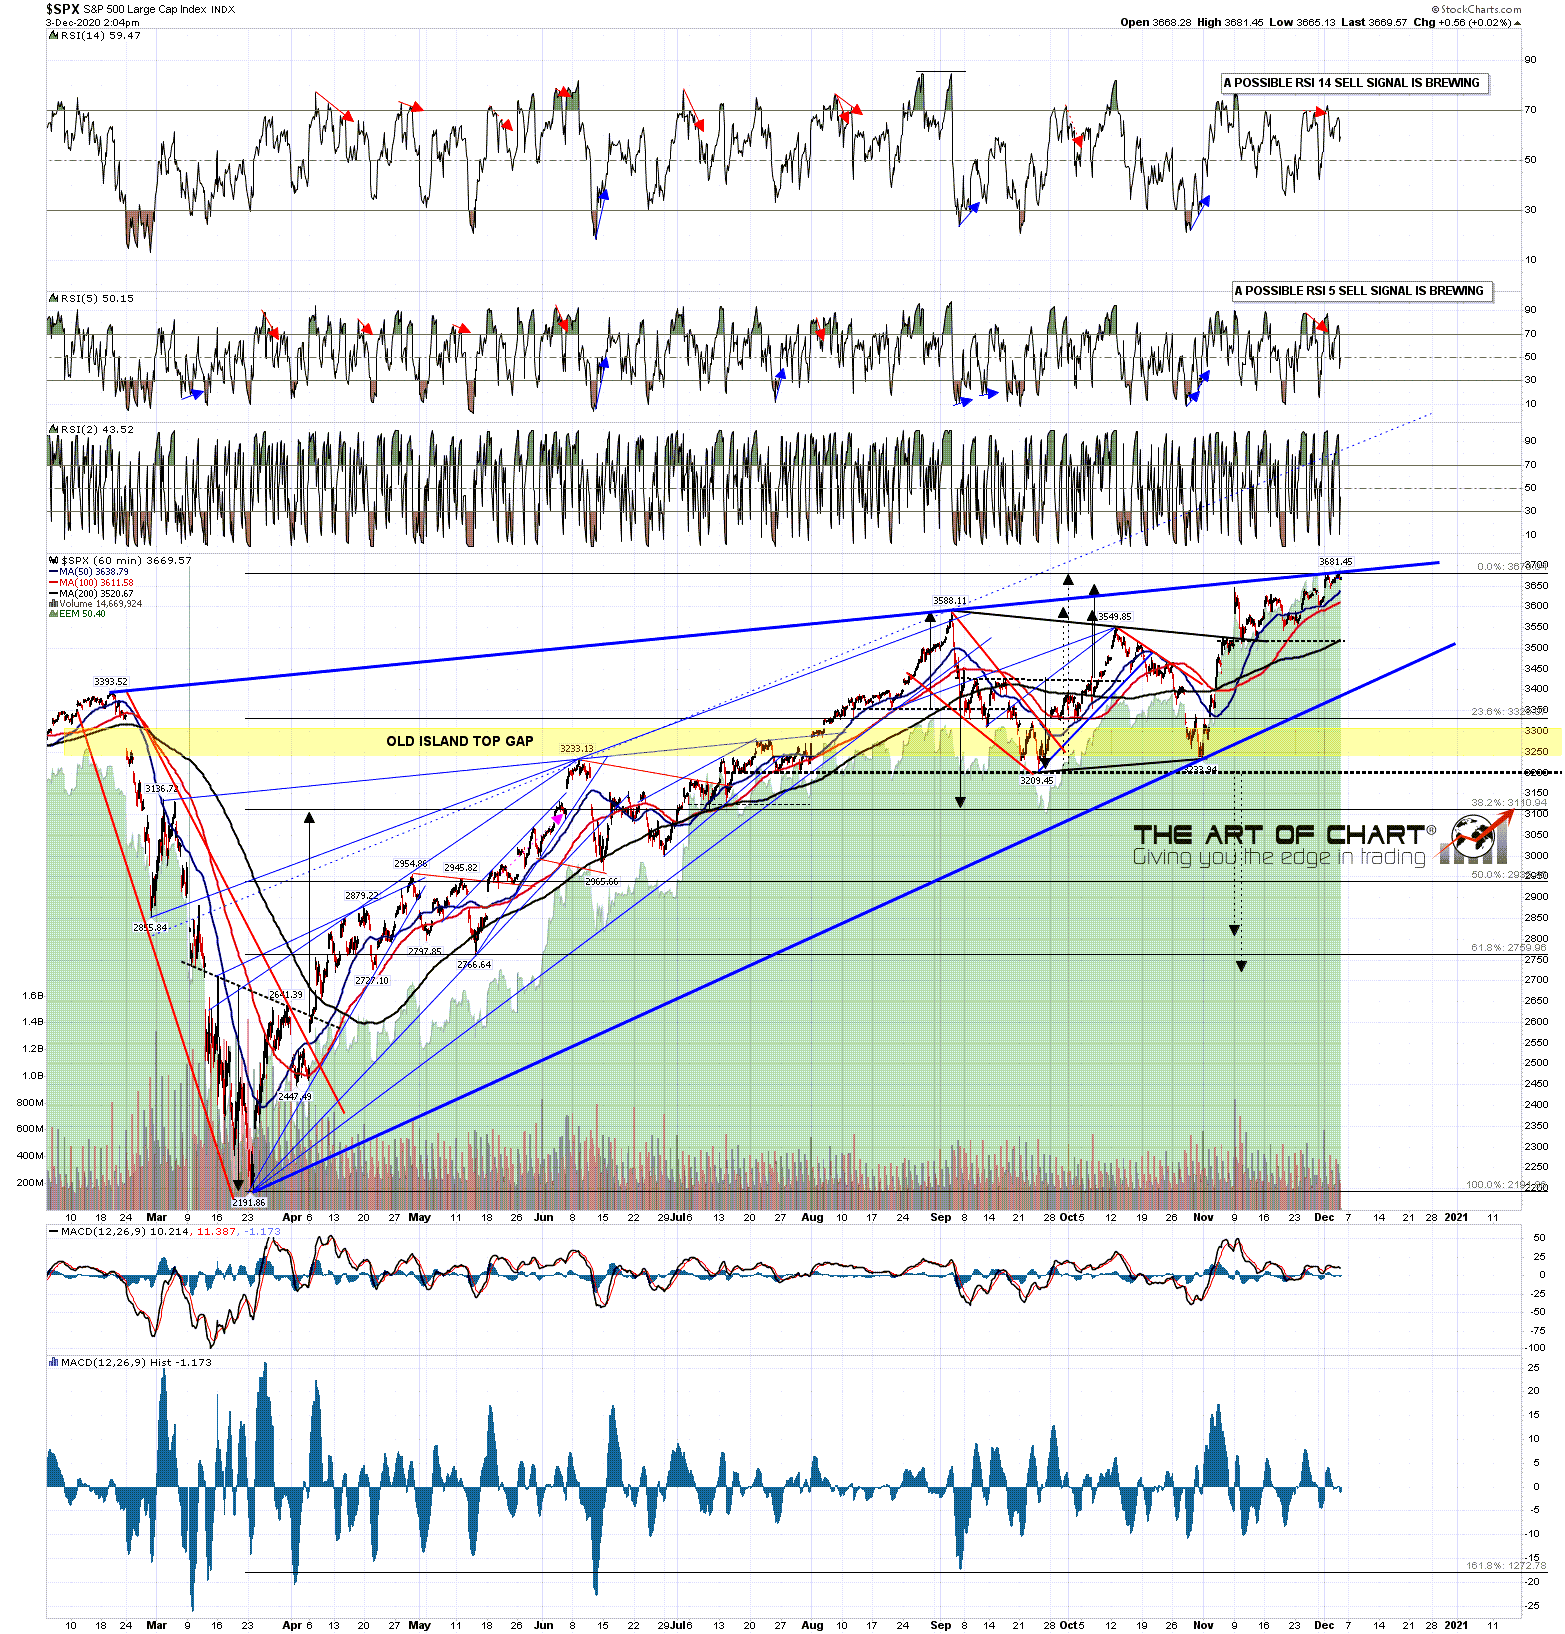
The daily chart on SPX looks very ready to roll over here. No more upside targets on SPX, NDX, IWM or INDU that remain to be hit and look like unfinished business.
SPX daily chart:

We have a service at theartofchart.net that covers tech majors and sector ETFs. We send out charts a couple of times a week and the chart below is the hourly TSLA chart I sent out on Sunday. There is a dotted trendline above price that is the potential rising channel resistance trendline that is a theoretical resistance level. I put these on charts a lot in case they are hit.
TSLA 60min chart (Sun 29th Nov):
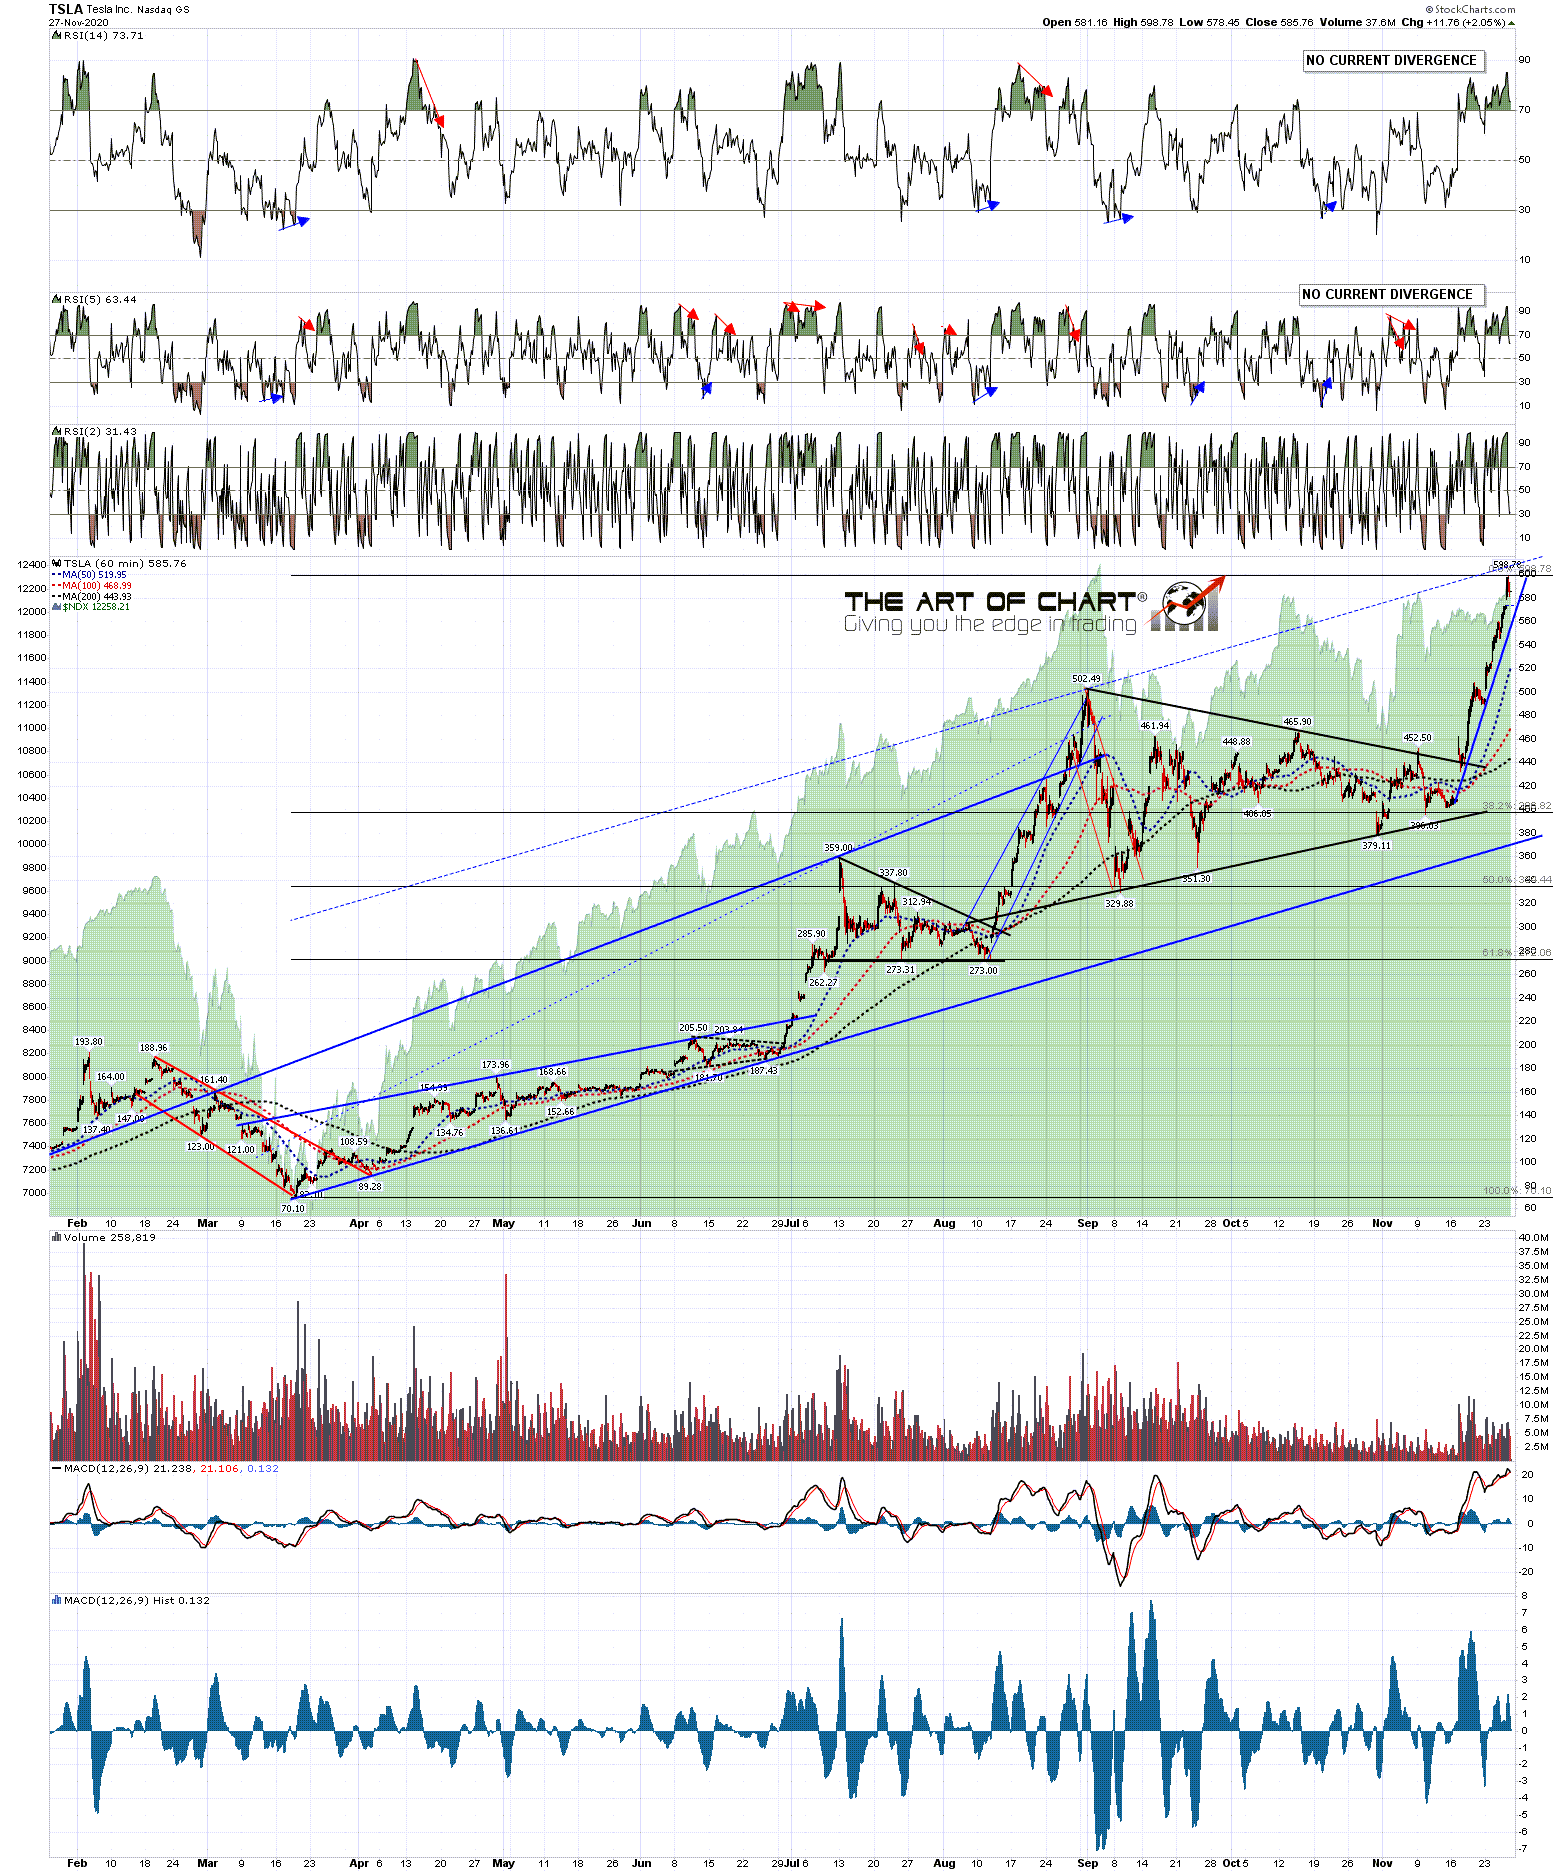
Here is the TSLA chart from today and as you can see, that rising channel on TSLA has now been established. Unless that breaks TSLA is also topping out here. It’s just one (very large cap) stock but there are a lot of signs that a significant high is being made here.
TSLA 60min chart:

We’ll see how it goes but until we see some significant evidence to the contrary, my working assumption is that equity indices are topping out here. Our December Free Webinars page has been posted and I’d mention that our free monthly public Chart Chat is at 4pm EST on Sunday 6th December. Be there or be unaware! 🙂
