
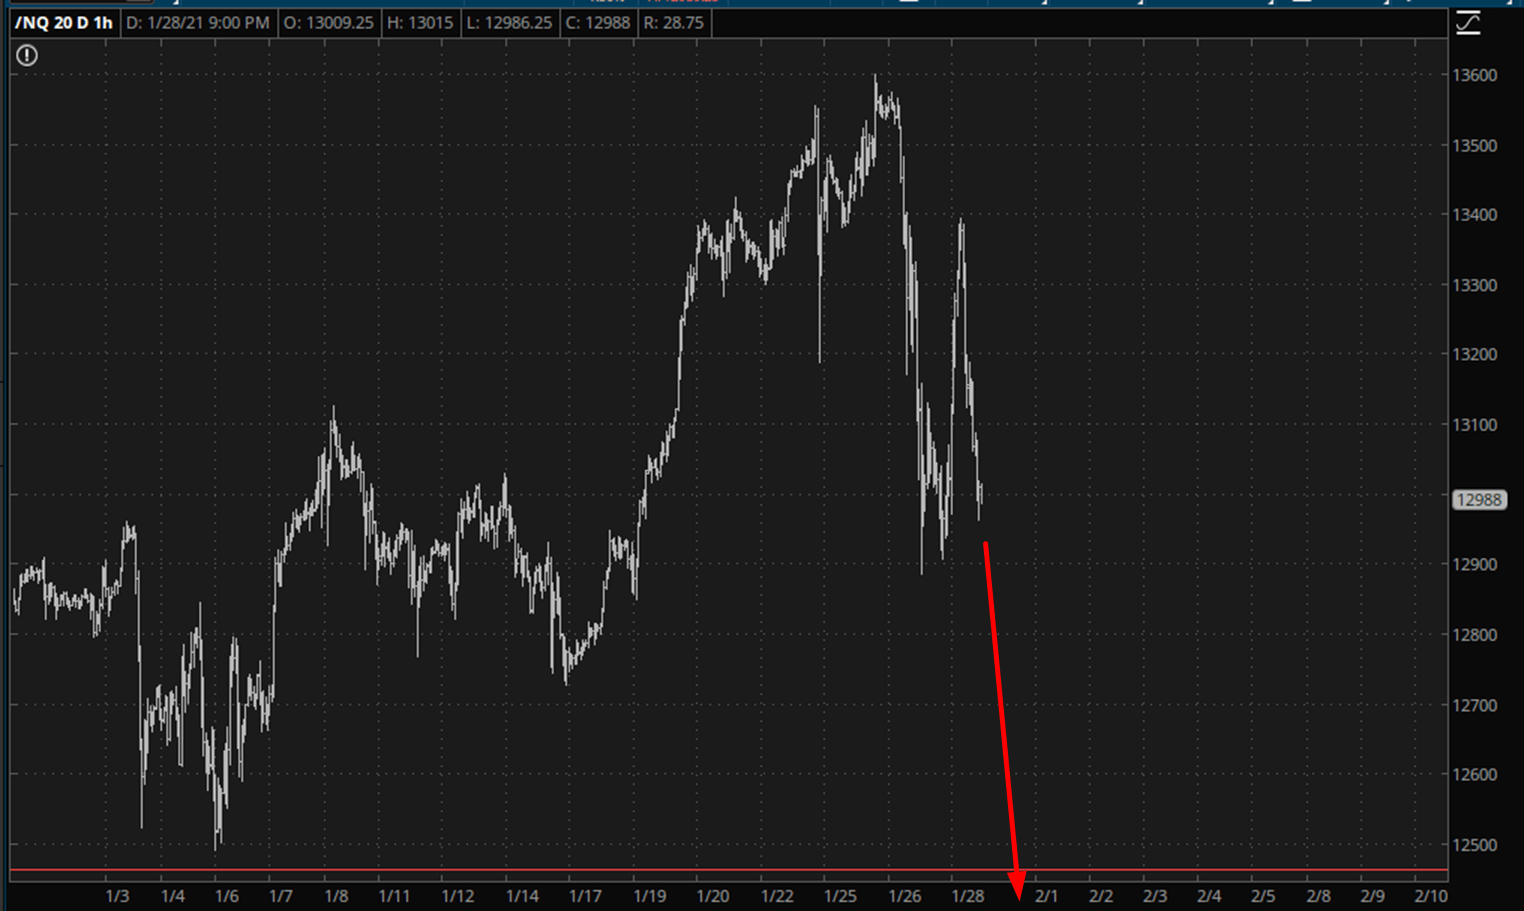
It’s Thursday evening as I am typing this, and the NQ is down over 200 more points. Nice! But the real key is a certainly horizontal line which is its low for the year. I’ve drawn a red line showing how much deeper selling would have to go to break this line, thus creating a failed bullish breakout.
Here is a longer-term view of the NQ. As you can see, that horizontal line is a key support level.

Let’s look even farther back, and this time by way of the NASDAQ 100 cash index. We are right at the cusp of a potential trendline break. And this is no minor trendline: this is the Big Kahuna from March 23rd of last year. If the NQ dip we’re seeing right now is still with us when I wake up, this trendline is guaranteed to be broken.

