
Think back New Year’s Eve, and all the uncertainty still surrounding COVID, and the aftermath of a disputed election. If an investor told you he had $500,000 and was unwilling to risk a drop of more than 20% over the next six months, what would you have suggested he do?
We addressed this question in a post published on New Year’s Day: New Year, State Of Fear:
Our approach to investing in a state of fear is to buy likely winners and hedge away the fear. Here’s an example, followed by an explanation. Let’s say that you have $500,000 in cash you want to put to work in 2021, but you aren’t willing to risk a drawdown of more than 20%. If you indicated that in our hedged portfolio construction tool on New Year’s Eve,
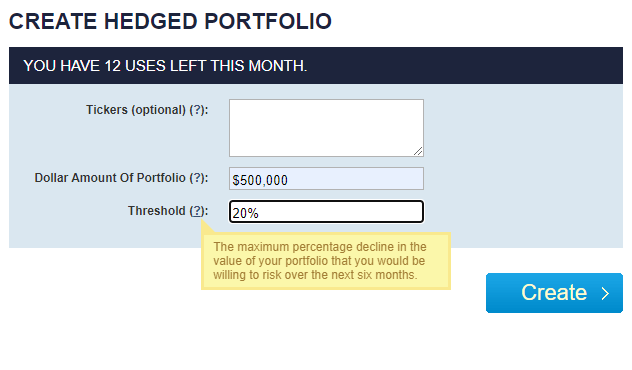
This and subsequent screen captures are via Portfolio Armor.
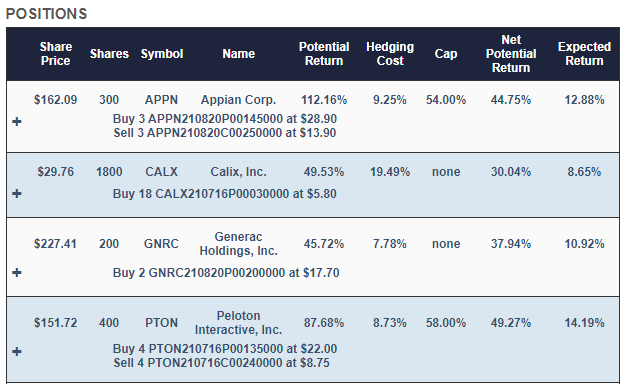
This is the portfolio it would have presented to you.
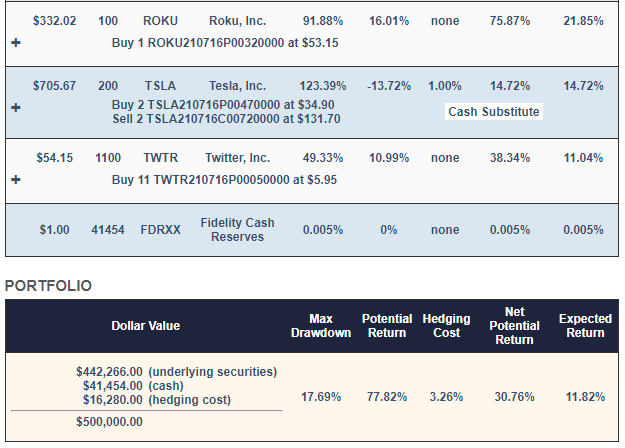
With this, your maximum drawdown over the next six months – that is, if every underlying security went to zero – would be a decline of 17.69%. Your best case scenario would be a gain of about 31%, and your expected return (a more likely scenario) would be a gain of about 12%.
Let’s recap quickly why we picked those stocks and hedges and then show how that portfolio did over the next six months.
Why Those Stocks
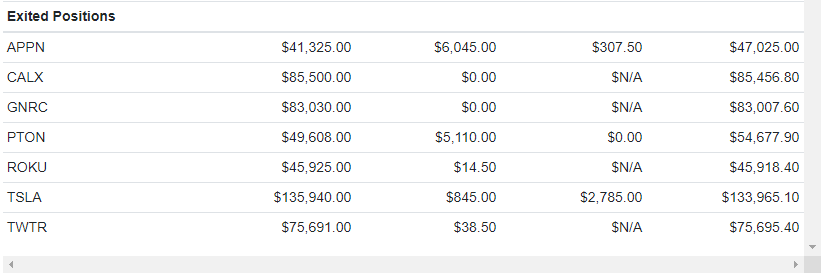
Each trading day, our system analyzes total returns and options market sentiment to estimate potential returns for thousands of stocks and ETFs. Appian (APPN), Calix (CALX), Generac (GNRC), Peloton (PTON), Roku (ROKU), and Twitter (TWTR) were selected six months ago because they were among our top names – the ones that had the highest potential returns, net of hedging costs. Our system started with roughly equal dollar amounts of each, and then rounded them down to round lots, to reduce hedging costs. It swept up most of the leftover cash from the rounding-down process into a tightly hedged Tesla (TSLA) position, to further reduce hedging cost.
Why Those Hedges
On our website, if you click the plus signs in the portfolio above, the positions expand to give you a better look at the hedges. For example, this is what the APPN position looked like expanded.
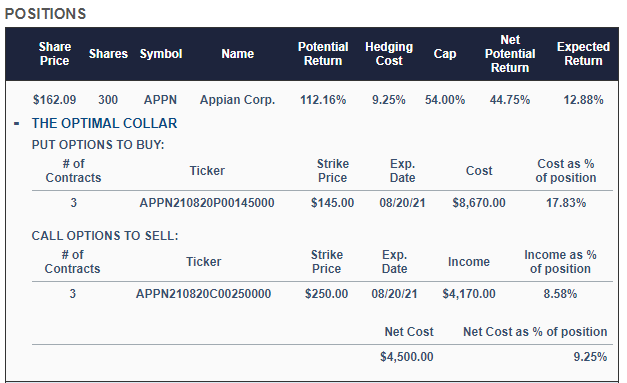
As you can see, APPN was hedged with an optimal, or least expensive, collar. Some of the other positions are hedged with optimal puts. Our system estimates returns both ways to determine which type of hedge is best. We elaborated on that process in a previous post: When To Hedge With Puts Versus Collars.
How That Portfolio Did
Net of hedging and trading costs, that portfolio was up 13.44% at the end of six months, in the ballpark of the 11.82% expected return our system estimated when it created the portfolio six months ago.
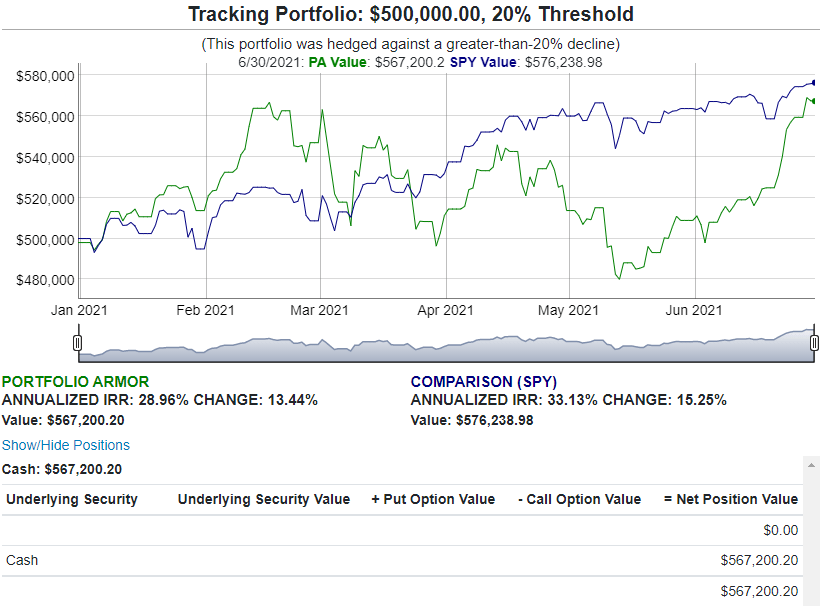
You can find an interactive version of the chart above here.
As it happened, the market shrugged off the fear and an unhedged investment in SPY would have returned 15.25% over the same time period. Still, better to have downside protection and end up not needing it than to need it and not have it.
