Apologies for the extended absence again as my interminable divorce drags on. That’s making progress though at least, and in a few months at most should be done.
In the meantime I posted my premarket video at theartofchart.net from this morning on my twitter in the morning and on indices so far at least that has been exactly on target. If you missed that then you can see that here.
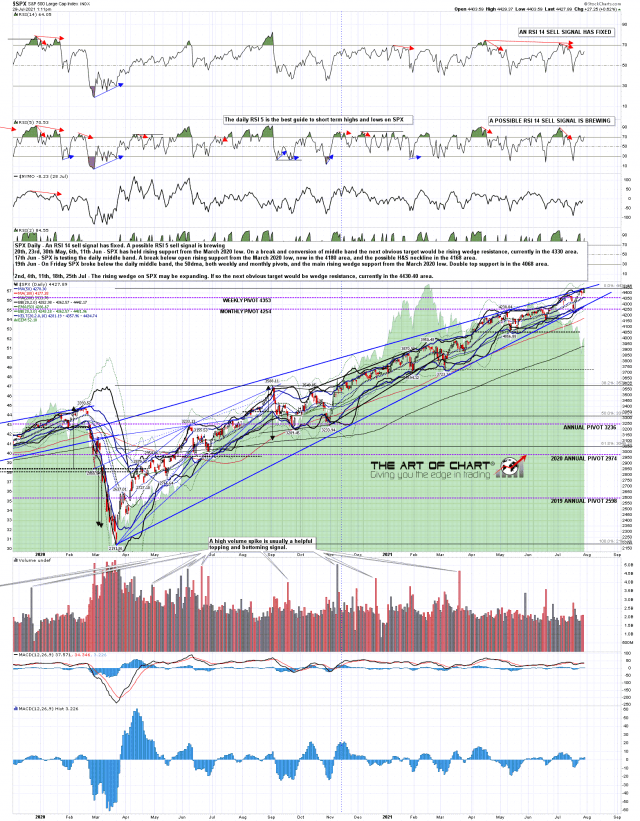
Just to recap quickly what I was saying on the video, I was expecting SPX and NDX to rally into retests of the strong resistance trendlines that have been holding so far this week on both. We have seen that retest on SPX and a daily RSI 5 sell signal is now brewing as expected. If that fixes then these have been good performers for delivering retracements this year.
SPX daily chart:

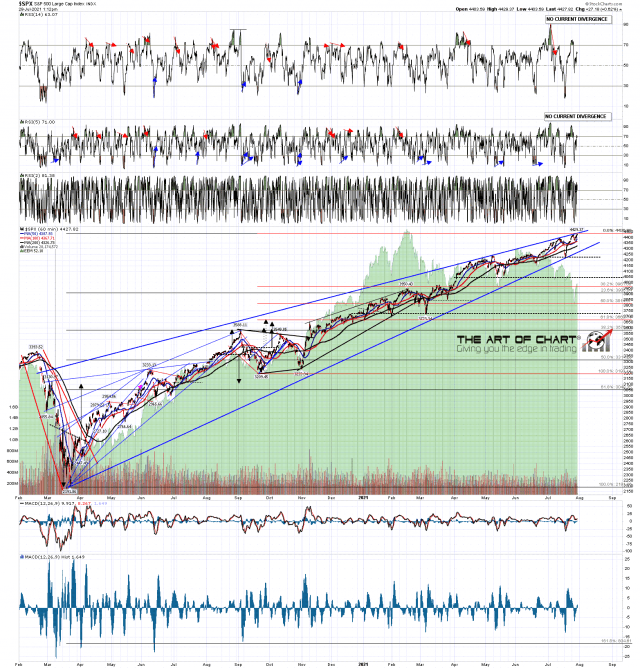
If we do see that reversal then there is a nice little double top setup that could deliver a move back to 4320, and possible larger topping pattern support in the 4233 area.
SPX 60min chart:

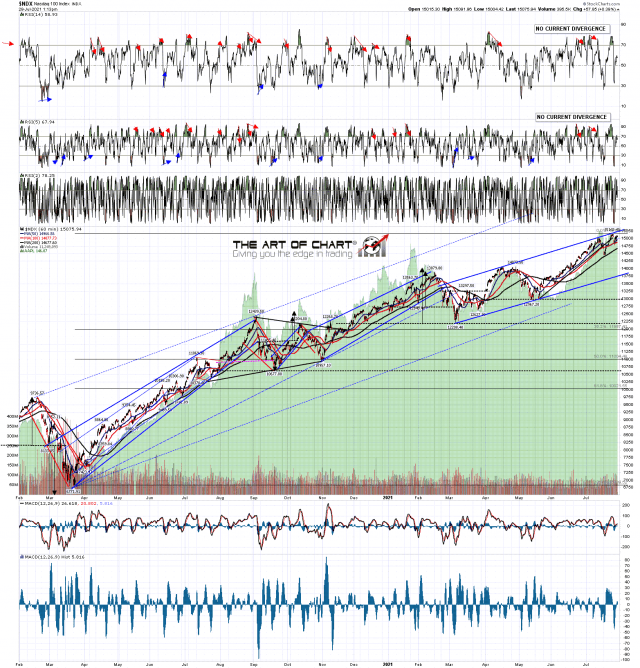
The trendline on NDX isn’t as long but has held like a champ so far. That may need a high retest though and, if so, we haven’t seen that yet.
NDX 60min chart:

Resistance still needs to hold tomorrow, which leans bearish as the last day of the month, though Fridays have been mostly bullish lately. Monday is the first trading day of August but that is one of the few of these that leans bearish.
Stan and I are doing our monthly free review of tech stocks and sectors an hour after the close tonight. If you’d like to watch that you can register for that here, or on our July Free Webinars page.

