
I was talking in my last post on Friday about the likely mean reversion move coming that should at least return SPX to a backtest of the 45dma, now at 4549. The low so far today has taken SPX down to the 4565 area, so that is getting close, and SPX is now in an area where it may turn back up, though I think a test of 4540 is likely at minimum before that happens.
SPX daily vs 45dma chart:
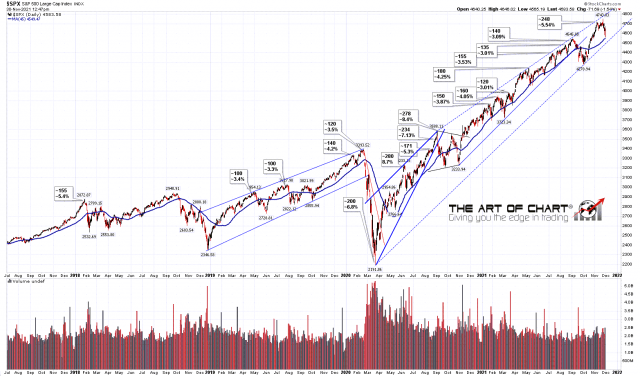
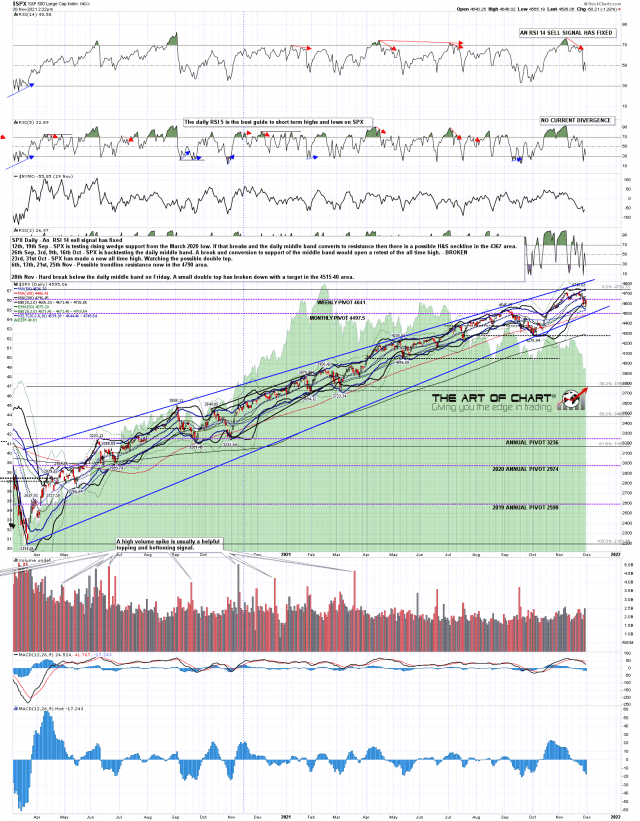
On the daily SPX chart the fixed RSI 14 sell signal is still well short of target, but doesn’t need to reach target before a serious rally of high retest from the next low. The rising support trendline on SPX from the March 2020 low is currently in the 4485 area, and would be the next obvious big support level on a sustained break back below the 45dma, currently in the 4550 area.
SPX may struggle to go lower than the lows reached today as the 3sd daily lower band is currently at 4573, and the current LOD at 4665 was eight points below that. If we should see a close on or below the 3sd lower band today then that would be a strong sign that a short term low is in or very close.
SPX daily chart:
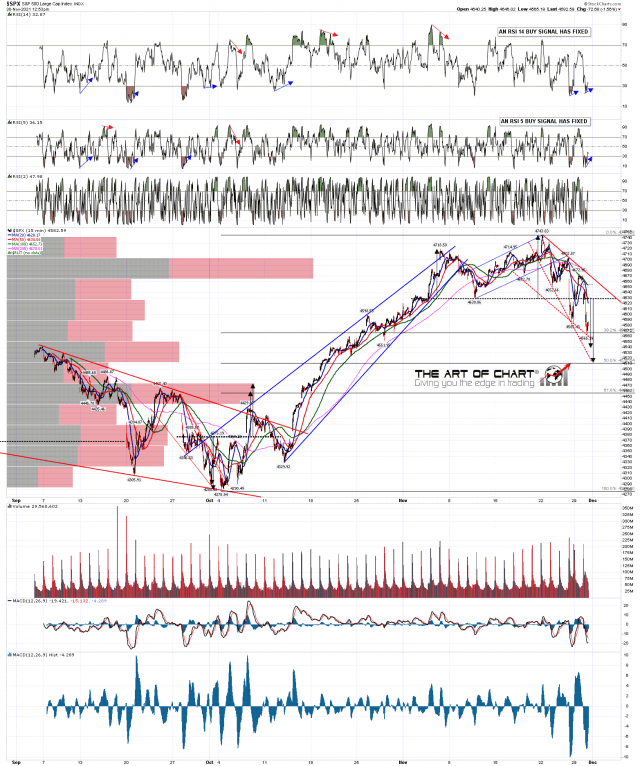
On the SPX 15min chart the open double top targets at either 4540 or 4515 areas are getting close.
SPX 15min chart:
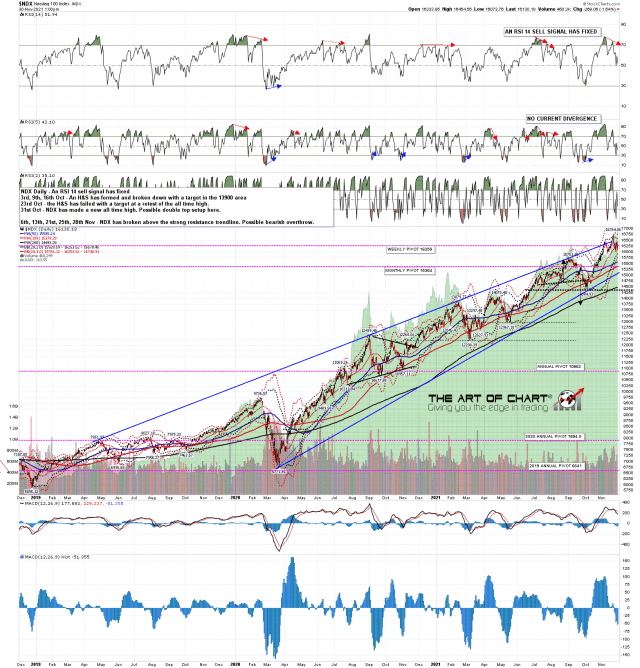
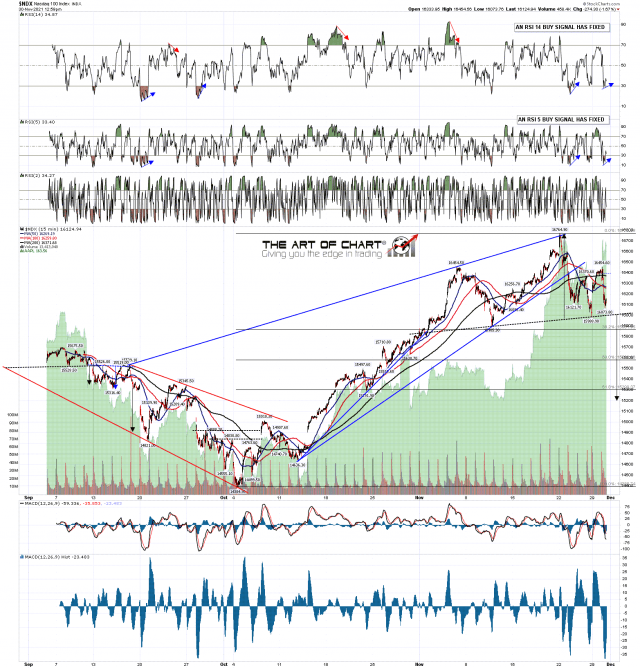
On NDX the fixed daily RSI 14 sell signal is only halfway to target, and while the last retracement was led by tech, this one is being led by the Russell 2000 and Dow Industrials. That is promising for tech longs after this retracement ends.
NDX daily chart:
On NDX there is a large possible H&S forming on the 15min chart. I’m doubtful about that delivering much unless SPX can break below rising support in the 4485 area, but it is the kind of setup where the neckline would often break before a rejection back up into the highs.
NDX 15min chart:
The obvious target on SPX is the 4540 area and I think that will likely be tested in the next day or so. That would be a candidate low area. If broken significantly then I’d be watching the key support level on SPX at rising support from the March 2020 low, now in the 4485 area. I’m not expecting that to break on this move, but if it does that could open significant further downside.
I was saying on Friday that the historical stats yesterday leaned strongly bullish yesterday and bearish today and those both delivered. The next few days are modestly bearish tomorrow (Wednesday) and Friday. significantly bearish on Thursday, and leaning neutral to modestly bullish next week.
We are in the last couple of days running our annual Black Friday and Cyber Monday sale until midnight on Wednesday 1st December, with deep discounts on annual memberships at theartofchart.net, and if you are interested you can find out more about that here.
