
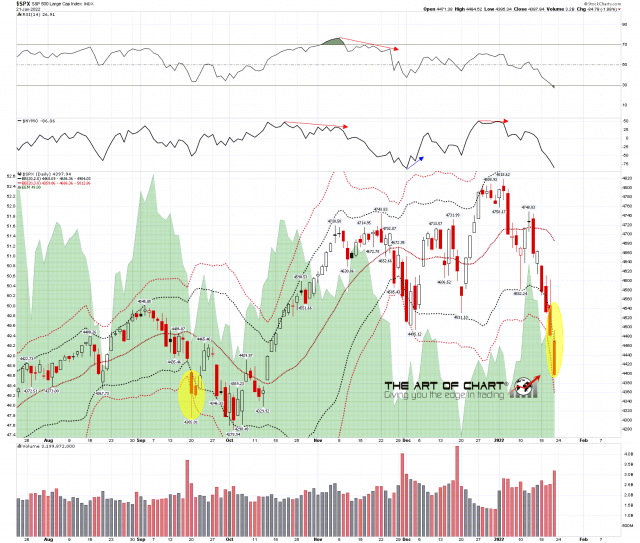
The type of very strong daily lower band ride that I was describing on Friday turned out to be exactly what we saw, so I’m taking a moment to look at that this morning as these happen on a regular basis, two to four times a year or so, and tend to behave in a very characteristic way.
Looking at the SPX daily chart below, with just the two and three standard deviation bands marked, you can see how the body of the daily candle for the last two days is roughly under the 2sd daily lower band. That is normal, though a little misleading as I was noting on Friday that these often find resistance very close to the daily lower band. It looks from the chart as though the high on Friday was well above the 2sd lower band, but that’s because the 2sd lower band declined from 4492 at the time of the high of the day, with that high just above at 4494, into 4468 at the close.
I have highlighted the last one of these stronger daily lower band rides in September 2021, and you can see how the low was made with punch well below the 3sd daily lower band, with a high volume spike the day before. Both of those signal that the odds of a decent reversal being close are very high. On the third day SPX broke back over the 2sd daily lower band, rallied back towards main downtrend resistance at the daily middle band, and then retested the low to form the double bottom that ended the retracement. All pretty classic stuff.
What is all this telling us here? Well I’m obviously watching for a strong volume spike, but in terms of the bands the most important resistance level today is the 2sd daily lower band, currently at 4468. A sustained break above opens a possible rally to the daily middle band, currently at 4669, and may well mean that a significant short term low is being made.
SPX daily BBs chart:
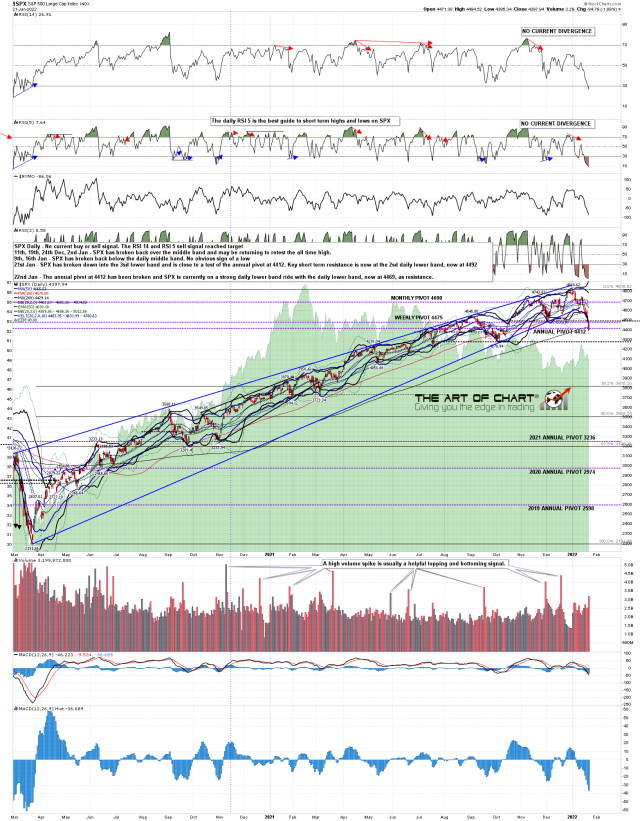
On the SPX daily chart the RSI 14 sell signal has now reached target, as has the same signal on the NDX daily chart. The possible H&S neckline in the 4500 area has broken, and if this decline continues the next obvious support is next next big level and possible H&S neckline in the 4280 area.
SPX daily chart:
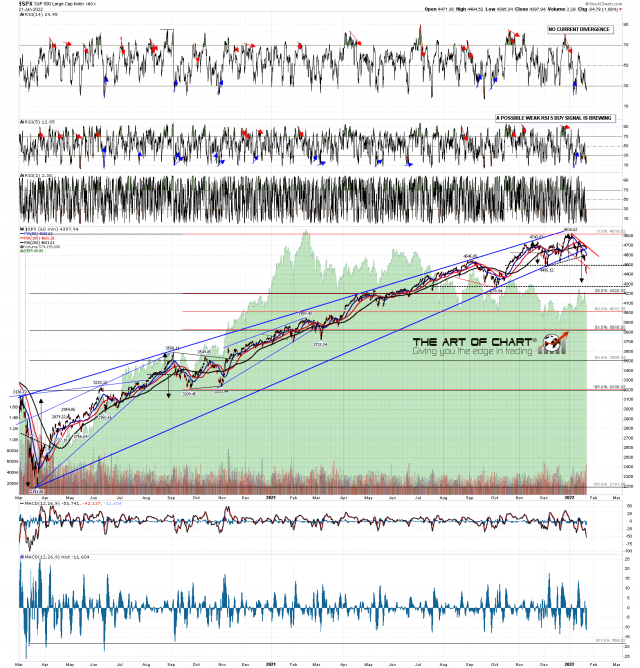
There was a little positive divergence on the hourly RSI 5, as there is also on NDX and IWM, but it is marginal and could be easily extinguished with a further decline.
SPX 60min chart:
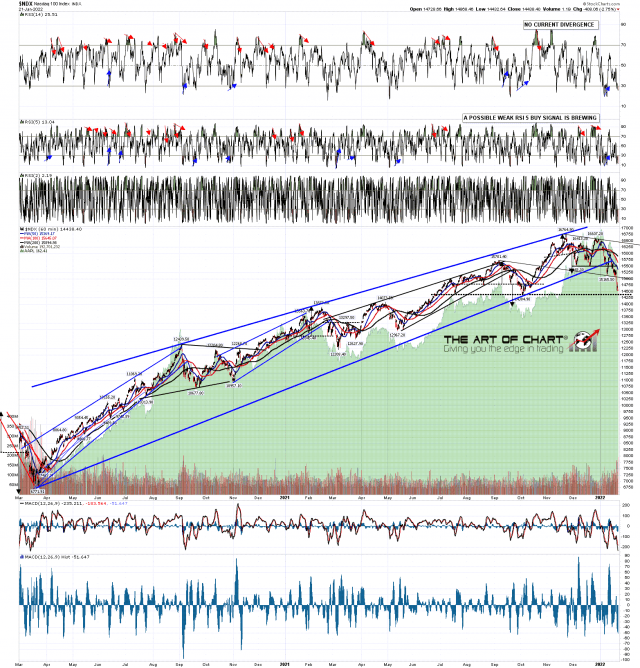
I was mentioning on Friday that there is some possible support that might hold before SPX had a chance to go down to the next level and that support is now being tested on NDX and INDU. On NDX that is the possible H&S neckline in the 14385 area.
NDX 60min chart:
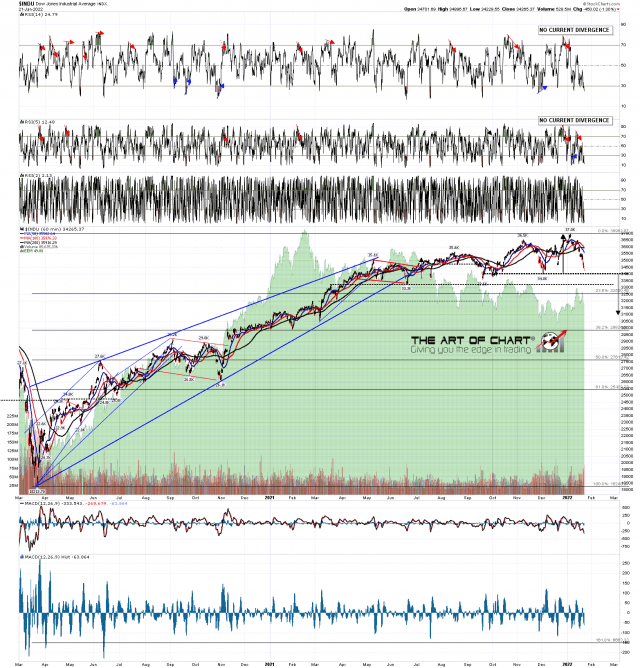
On INDU the support is the possible H&S neckline in the 34000 area. A break below opens the larger possible H&S neckline in the 33,300 area.
INDU 60min chart:
There is some positive divergence here on the hourly futures charts, but nothing yet indicating that a reversal is imminent. I’ll be watching the SPX 2sd daily lower band today, starting the day at 4468, and if we see a sustained break above that then this strong daily lower band ride is likely over. If we see the daily high in that area, then we may well see a strong lower low in the afternoon that could potentially take SPX down into a test of the next big support area around 4290.
