
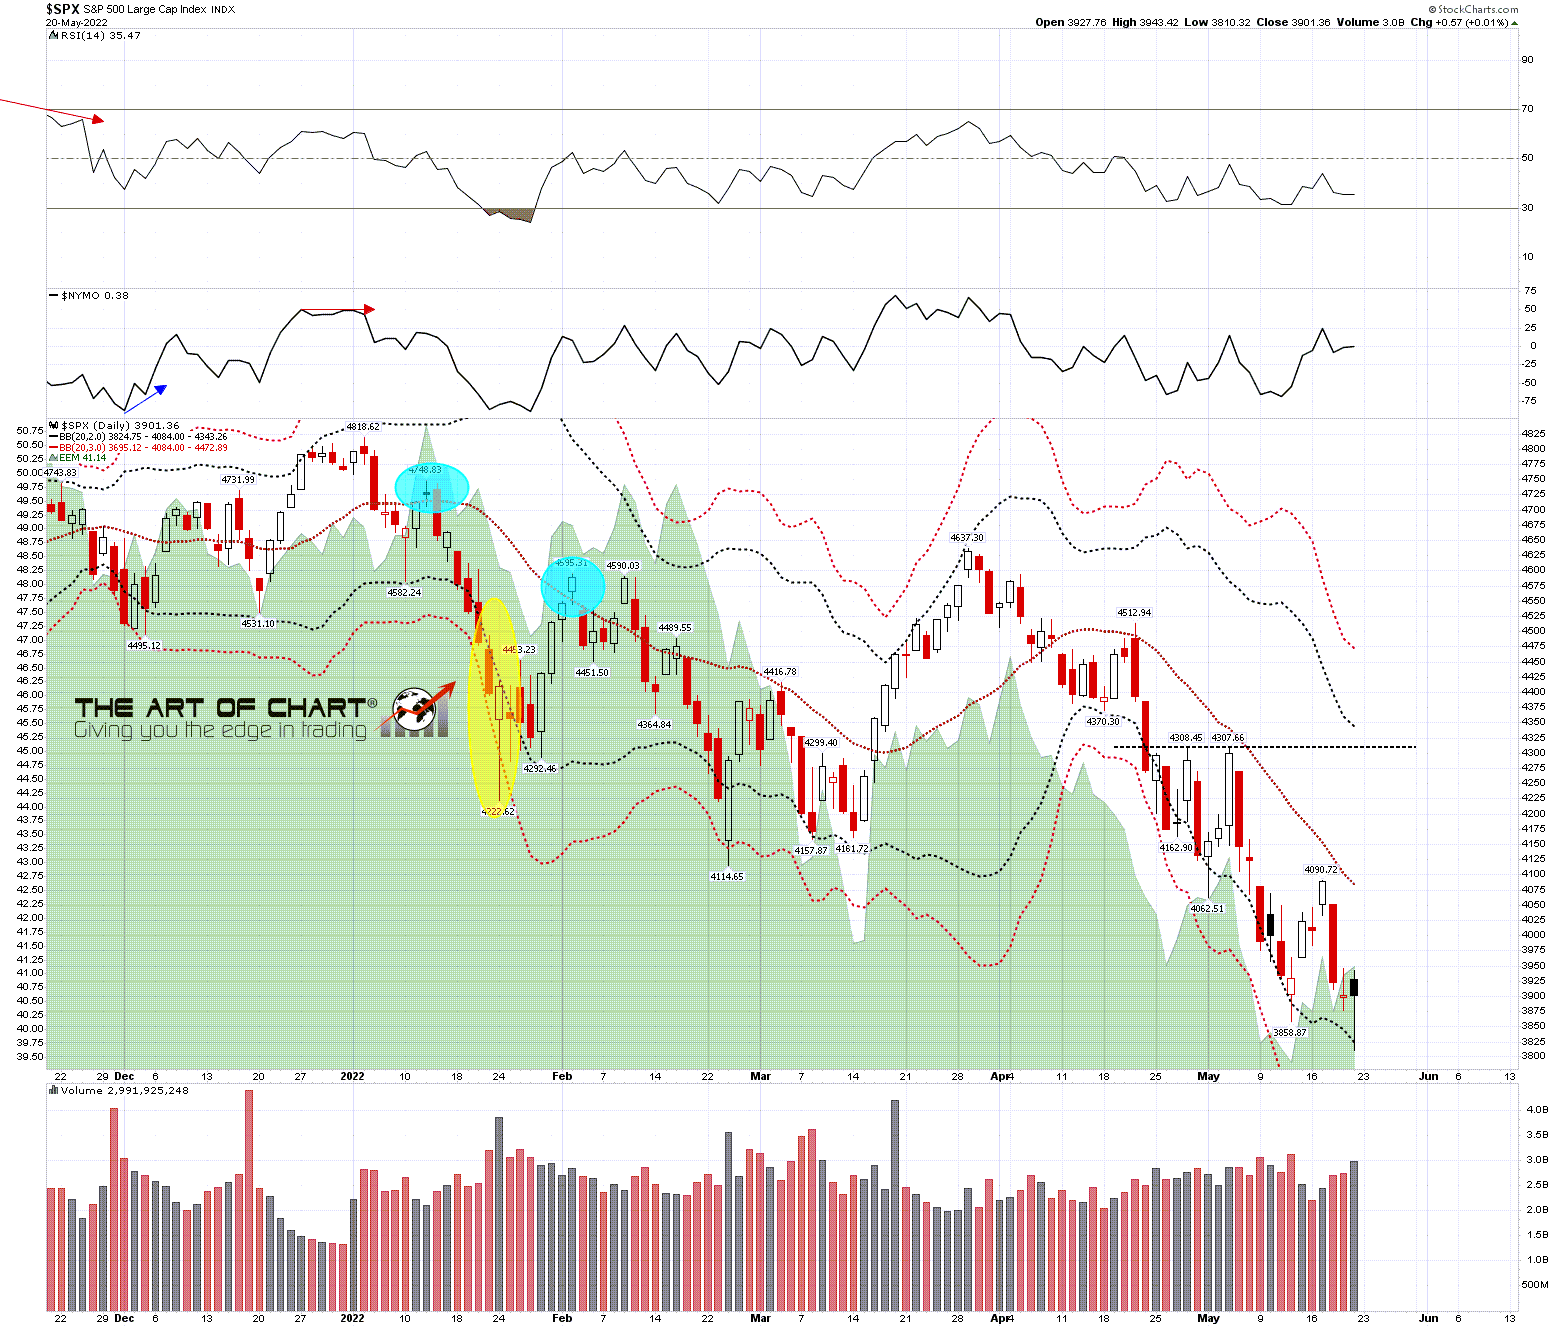
I was disappointed to see SPX close well below the main support and resistance trendline on Friday (Editor’s Note: Why? Why on Earth?) . This has only happened twice since the start of 2009, and on both occasions SPX followed through the break with force. Two instances is somewhat less than a statistically significant sample, but further downside is now undoubtedly open, even if the bull flag setups on many indices, sector ETFs and stocks are still intact.
SPX weekly chart:

The target at a full retest of the retracement low was made though, and there is now a decent looking potential double bottom setup on SPX, even if the lack of positive divergence is suggesting that no significant low has been made. SPX might get a decent rally here though, with obvious short term resistance at the 50 hour MA currently at 3962, and the 5dma currently at 3964. If this double resistance is broken and converted to support then the next obvious level would be the daily middle band, now at 4084.
SPX daily BBs chart:
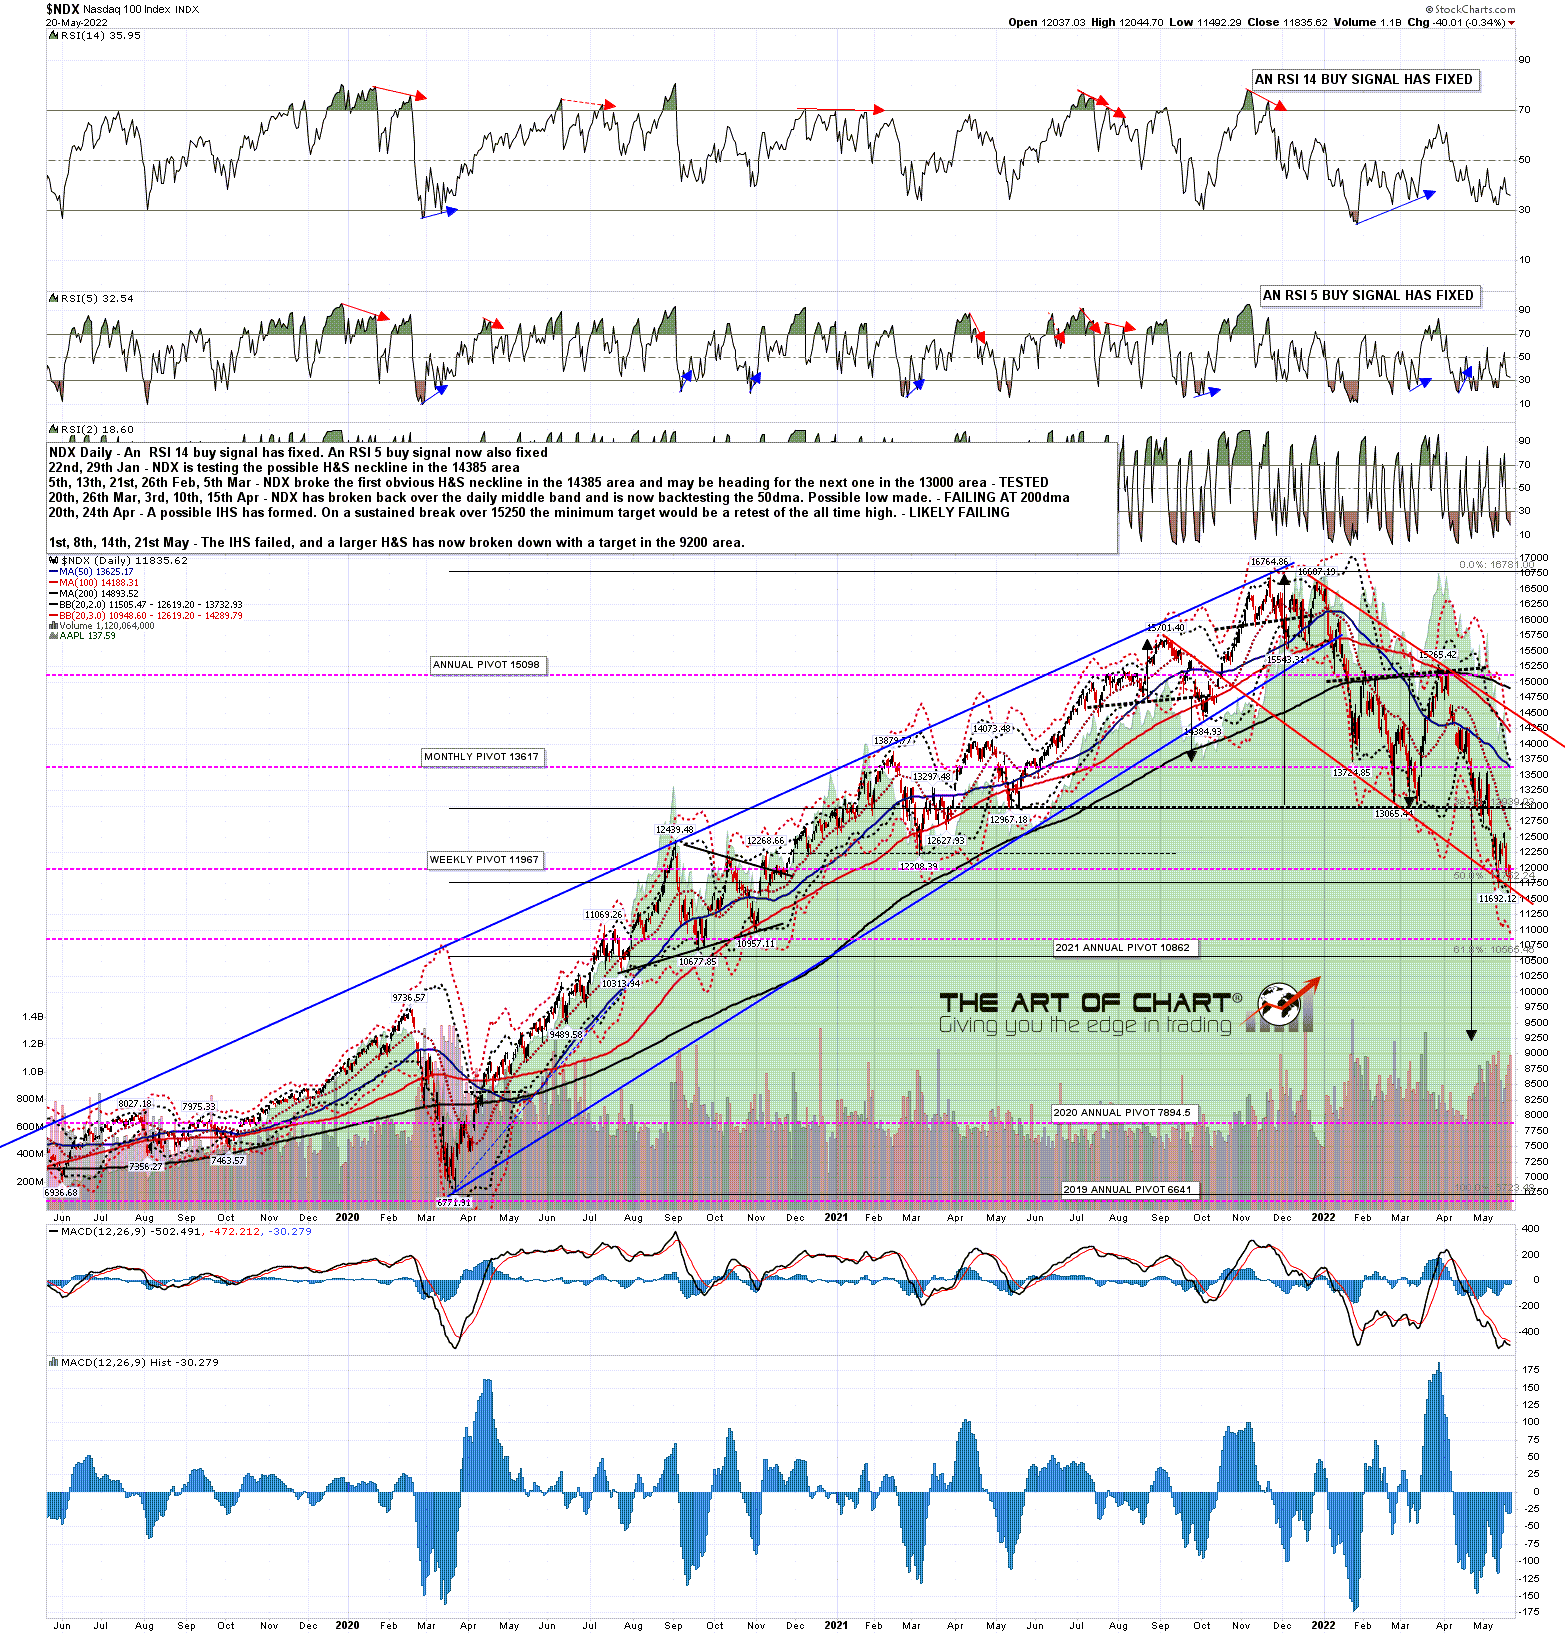
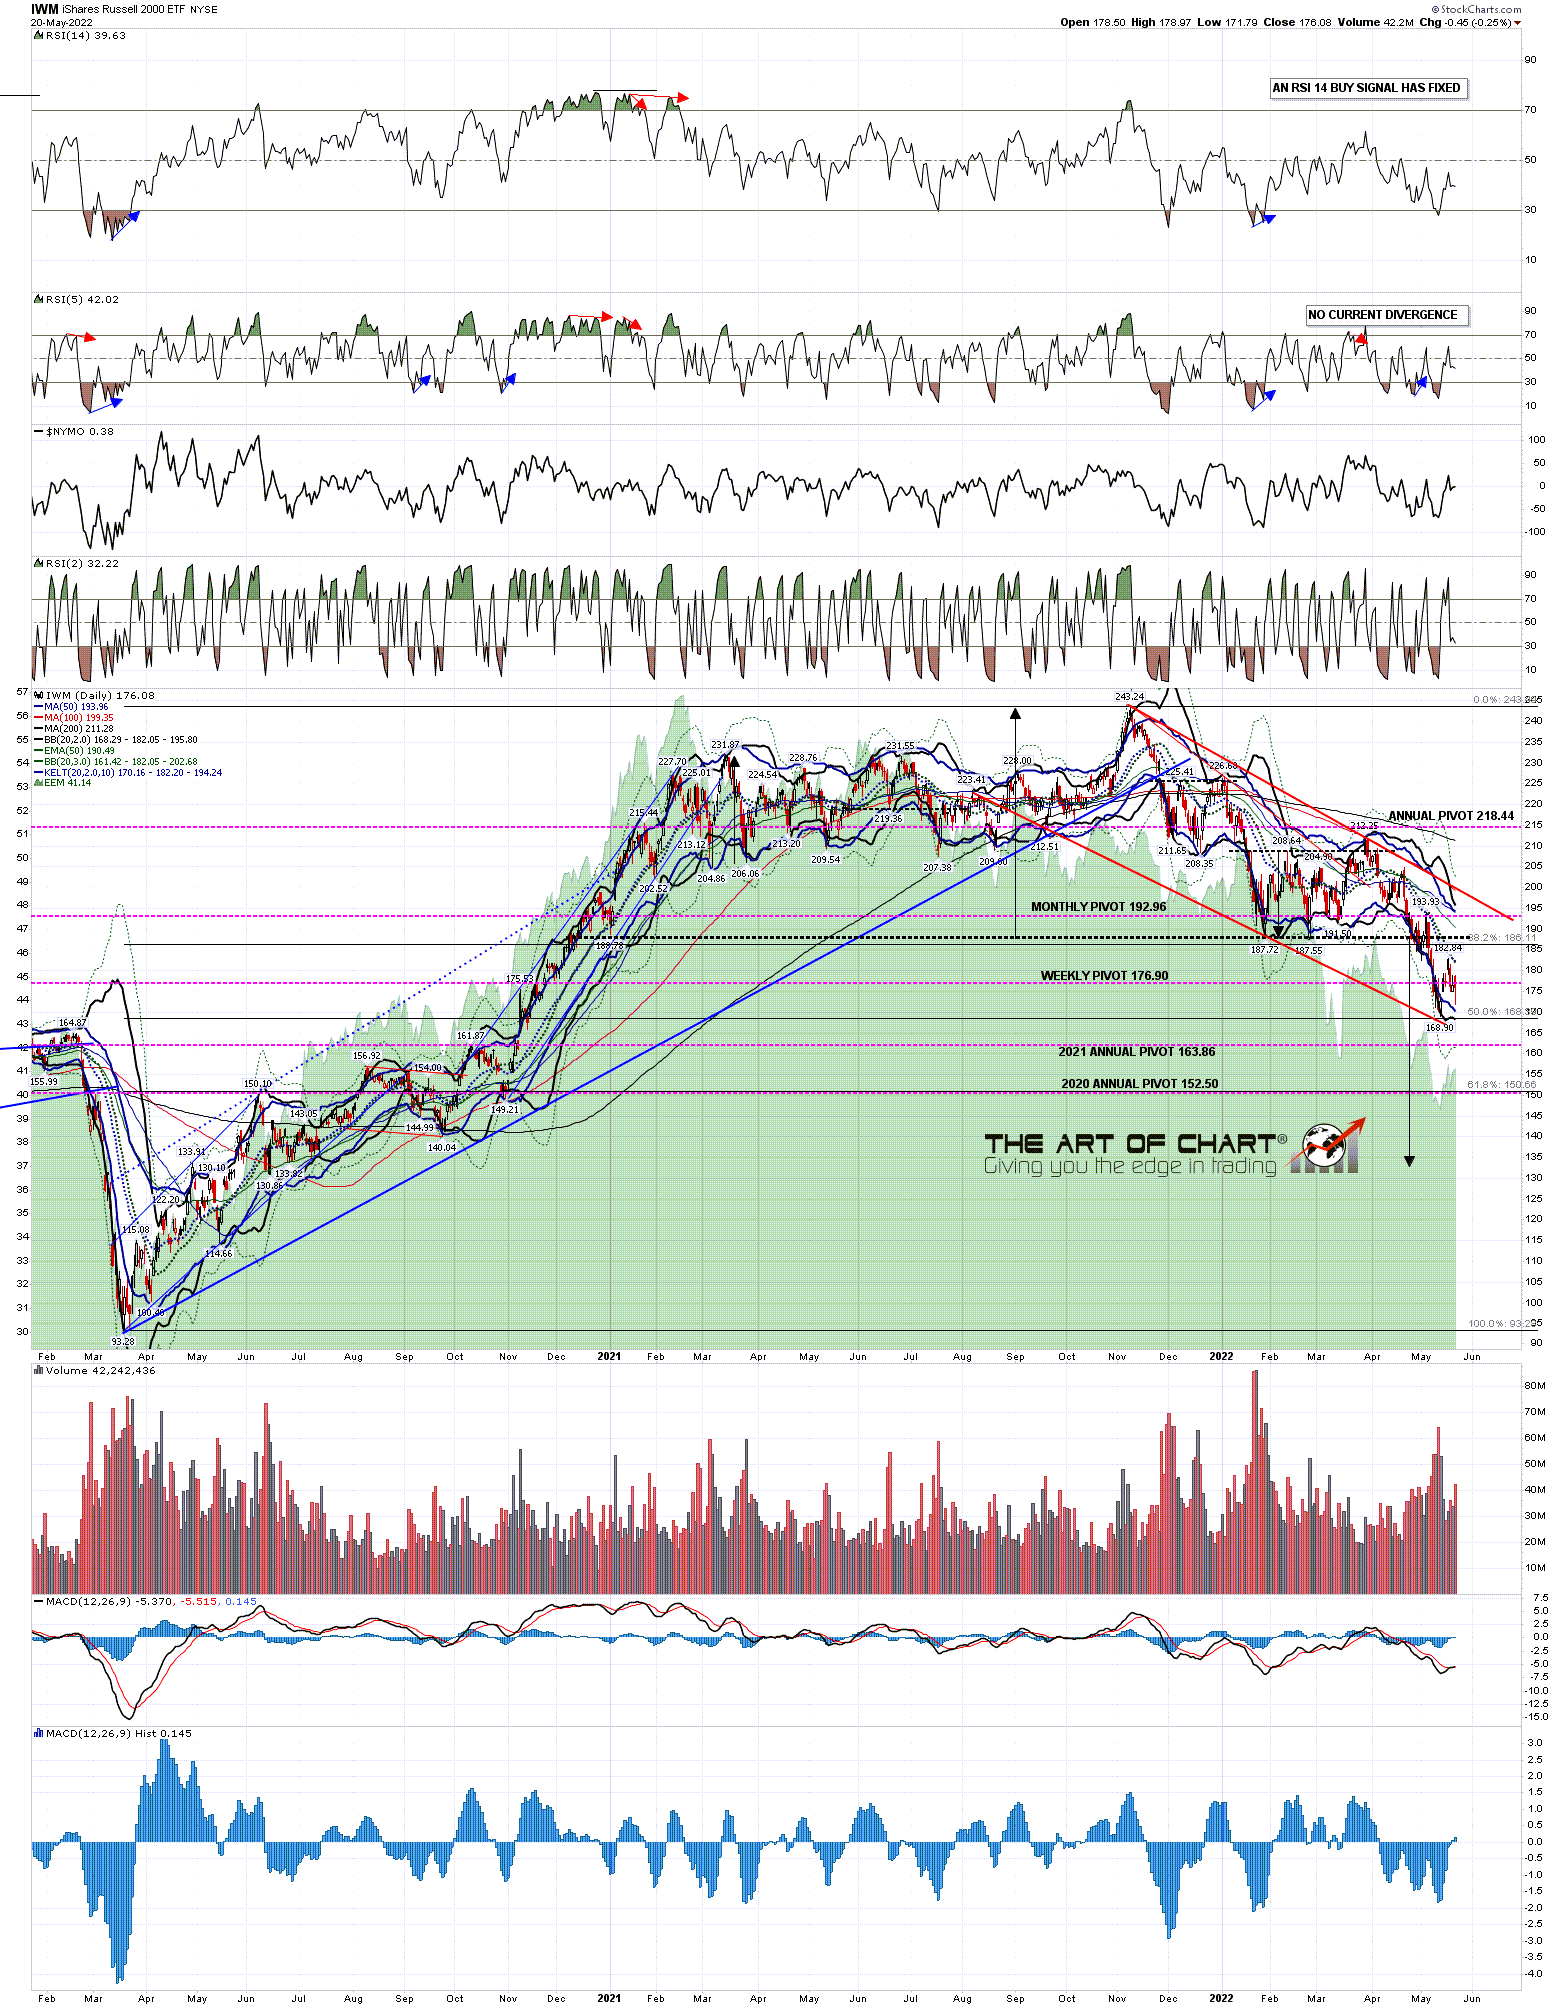
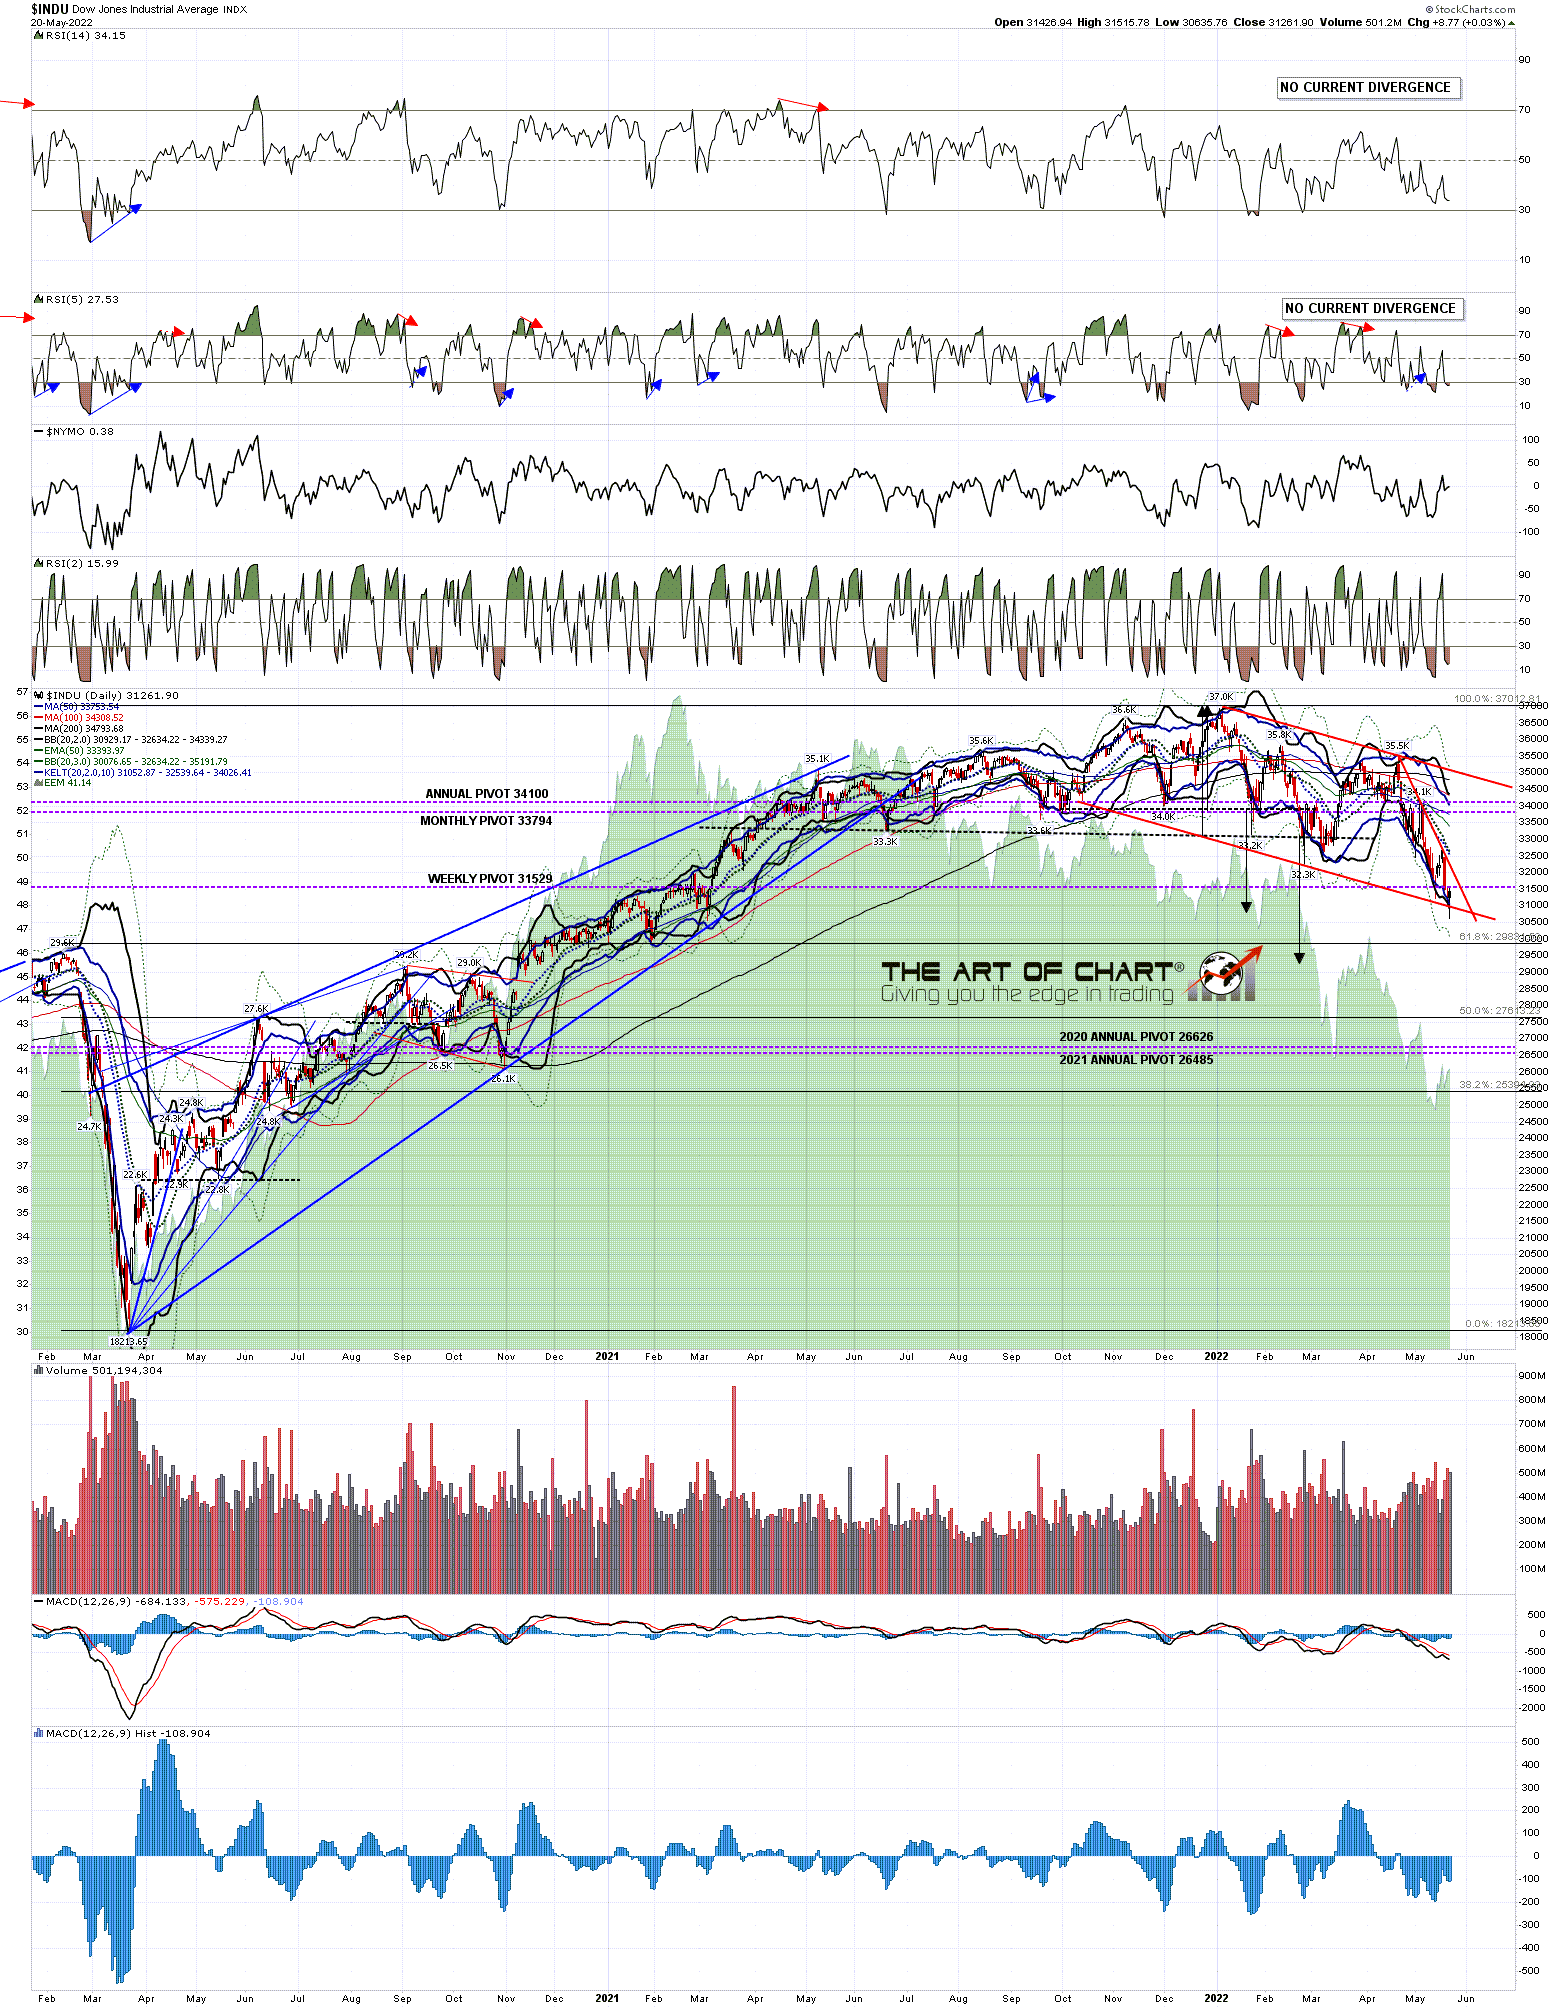
I still like the overall bull flag setups here that if a sustained low could be made could set up retests of the all time highs, but as targets further down are now opened up I would like to go through the main ones of those on the US indices.
On SPX the original H&S failed, so there is now obvious downside targets there, and that is one reason that I have been favoring the high retest scenario, but there are decent topping patterns on NDX, IWM and Dow, so I’m showing where those targets are in the event that equity indices head significantly lower.
On NDX, where the bull flag setup is decent but not strong, the obviously lower target is an H&S target all the way down in the 9250 area. At that stage NDX would have retraced 75% of the move up from the 2020 low.
NDX daily chart:
On IWM the bull flag setup is again decent, though IWM has not yet either retested the last low, which looks like unfinished business, and may need to test flag wedge support currently in the 165 area. In the event of a break lower the lowish quality H&S target would be in the 133 area.
IWM daily chart:
On Dow the bull flag channel was very high quality, but has been weakened by an intraday break below it on Friday. That isn’t terminal, but it may mean that an alternative support trendline is forming. The first high quality double top target in the 30750 area has been reached, but there is also a decent quality H&S target below in the 29250 area.
INDU daily chart:
This is a holiday week and the historical stats lean bullish every day, most strongly on Wednesday and Friday. Next Tuesday is the last day of June and leans neutral to bearish, and the first two trading days of June on Wednesday and Thursday lean strongly bullish at 72% and 76% green closes on SPX respectively. This week and next week are therefore a very natural time to see a rally and I’m favoring at least a backtest of the daily middle band on SPX in that time.
In the event that the SPX daily middle band is broken and converted to support we could see a test of main resistance at the SPX weekly middle band, currently in the 4362 area.
On Thursday we are doing our monthly free webinar at theartofchart.net on Big Five stocks and (eleven) Key Sectors and if you’d like to attend you can sign up for that here, or on our current Monthly Free Webinars page.
I also want to mention that our Follow The Leader service at theartofchart.net is up 100% so far this year. That is part of our Triple Play service and can be auto-traded at striker.com. The profits on that so far this year on the nominal account of size at $10k would be enough to pay the Triple Play subscription for eight years. If you’d like to have a free trial of the Triple Play service you can find that here.
