
I’ll start by stating the obvious: It’s been a rough month to be a bear. I had warned about 3920 being a devastating technical level should we break above it. I’ll also admit that my “warning” was more for myself as others were already sounding the BULL alarm prior to that, but that was my technical level to watch. SPX successfully broke above that descending channel on July 19 and has continued a powerful rally since then, breaking through an important technical resistance zone, specifically 4080-4180. And here we are now thrust up just under 4300. Trying to come up with a bearish case is a very difficult prospect given this straight shot up. However, I would expect some volatility to reenter the market at the nearby technical levels as I expect anyone who got long near 3900 would like to take some profits near 4300 at the very least.
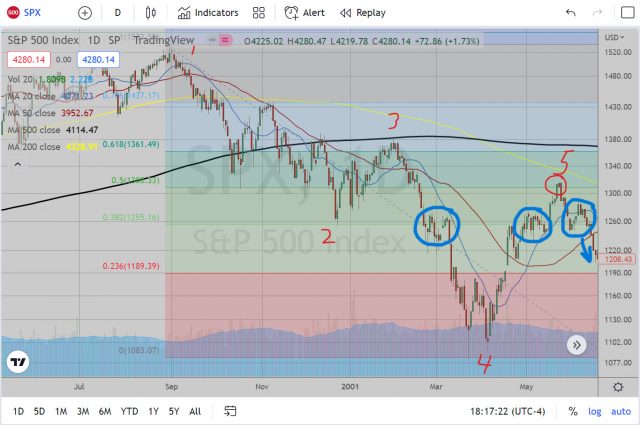
As for a potential reversal, my most bearish potential path would be immediate rejection from these levels. Why? To refer back to my analog analysis, I had been using past bear markets to consider potential bounce and rejection levels. As we have been moving along in our current bear market (or new Bull Market as some have called since this latest rally), I have found that this most recent bounce lines up very nicely with the bounce from April-May 2001.
Daily 2001 SPX Chart:
Daily 2022 SPX Chart:
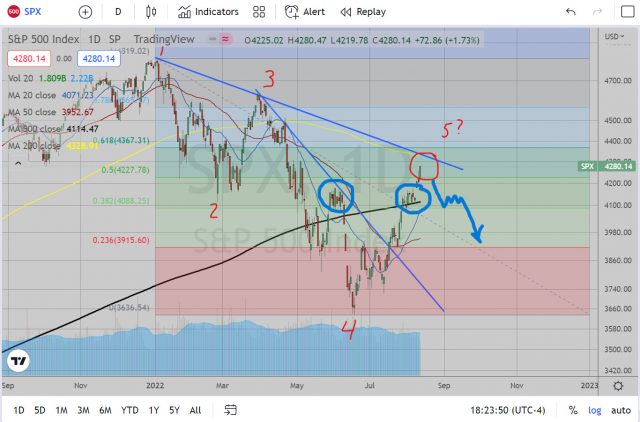
The percentage gain from the April 2001 low to the May 2001 high was about 21.7% bounce from inflection spot 4 before rejecting completely and continuing with the bear market as God intended. Our current bounce in 2022 has made it just under 18% bounce from the June lows (which I tagged as inflection spot 4). If this can successfully stop right here, it would make a perfect visual rhyme with 2001 (and would make me feel sane again).
However, working against this prospect are the fact that this is basically picking a top, which can be an expensive habit. I would need to see first the successful rejection (meaning by Wednesday to Thursday at the latest) with a successful retest back to 4100 before I start considering this as a viable path. Otherwise, this is just bear porn (you’re welcome).
Daily SPX Chart from August 12 (without notation):
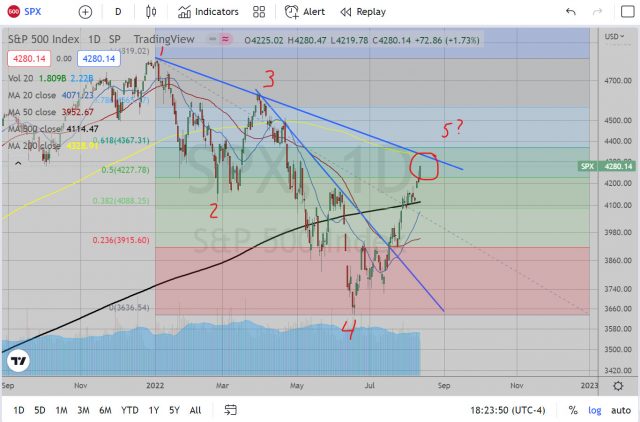
Looking at 2022 with a fresh perspective, potential resistance levels are the descending trendline since the market peak in December, which pretty much lines up with the Daily 200 EMA around 4330 and is also just below the Fibonacci Retracement of 61.8% at 4367 (Fib levels set from Market peak in December at 4820 to Market bounce in June at 3635); Not to mention the horizontal line at 4300 which acted as support in October 2021 and January 2022, and finally as successful resistance in April and May. All this is to say there is quite a bit of overhead supply coinciding in a tight zone up ahead.
I would hope to see some consolidation under these levels. I’ll wait to see a red candle day though before considering calling anything here (who knows when that will happen again). As we saw at 4080, this could just slice up through those levels with all the printed money still out there.
Monthly Chart as of August 12:
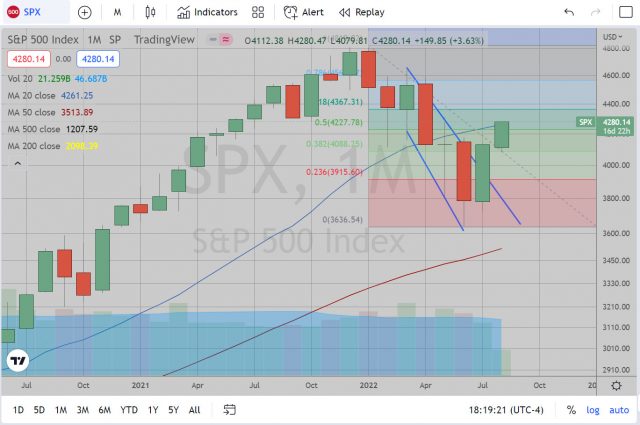
There is not much to say regarding the monthly chart other than the fact that we are now exactly at the Monthly 20 EMA. I would need to see this month close beneath this level (4270) to start feeling full-on bearish again.
In following my analog, I noticed that of the 5 bear markets I am using for my weighting of inflection points, this bounce we are seeing this year is matching closest to the 2001 bounce, which reached a 21.7% bounce before ultimately turning around (The other bear markets that I am using for weighting experienced bounces at this phase between 9% and 15%). If we saw this same percentage bounce this year from 3635, the rejection level would not be until around 4425. I myself would be puking at this level, but there it is. (Editor’s note: me, too!)
To sum up, the path before us is obviously fraught with danger for bears. We’ve had a fantastic bounce, though not entirely out of the realm of a bear market bounce as we saw in 2001. There is potential to see immediate reversal or continued push higher before deciding to roll back over. If you are feeling bearish, it may not be a bad idea to start building a position up here, though you may have to give it some room to run against you (depends on your risk tolerance). If you are feeling bullish and have an existing position, congratulations. You may want to consider taking some profits off the table. If you are feeling bullish and are looking to enter a new position, you may want to see some retracement and confirmed support to get a decent risk:reward.
I also want to end that this will likely be the last post of my current trade with relation to this analog. If the market breaks upwards from here, then the analog is broken for this particular trade. If not, then, well, it is successful, in which case the only mention I will make is to say “Told ya so!“. So, I’ll come up with new material going forward. But all in all, this was a fun little experiment that yielded some decent entries/exits in this bear market.
Good luck all.
