
From time to time, I’ll ask Slopers what features they’d like to see on the site. For years now, always near the top of the list, was the same thing: Volume Profile.
I resisted adding this, principally because of the challenges of finding a data source. Even the most ardent volume profile fans couldn’t articulate how to get the data. But I cracked that nut, and I’m delighted to say we’ve now integrated this into SlopeCharts. In a few days, this will be limited strictly to my beloved Gold and Platinum users, but for this initial rollout, I’m letting everyone try it so I can get feedback.
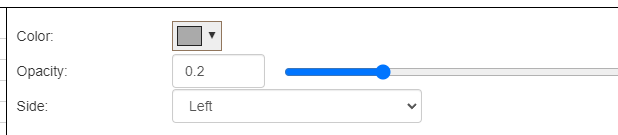
Volume Profile is accessed via the same Technical Indicators dialog box where all the other studies live. You have several controls: the ability to change the color of the volume profile, the opacity, and whether or not the profile is anchored to the left or right side of the screen.
Let me state the most important fact about this feature right now: at the moment, we only have the most recent 120 days of data (the good news is that this is VERY finely-grained data, down to 1 minute resolution). We are going to endeavor to acquire more data, and that could happen very soon.
The consequence of this is that if you’re looking at, let’s say, a 10 year chart, you’re only going to see volume profile data for the most recent 4 months of price action. For our purposes, however, this is really all you need, because the most recent four months is going to constitute the most relevant price action.
Here, for example, is the SPY with daily price bars:

I can change this to a 60-day intraday chart and see the same information on a fine timescale:

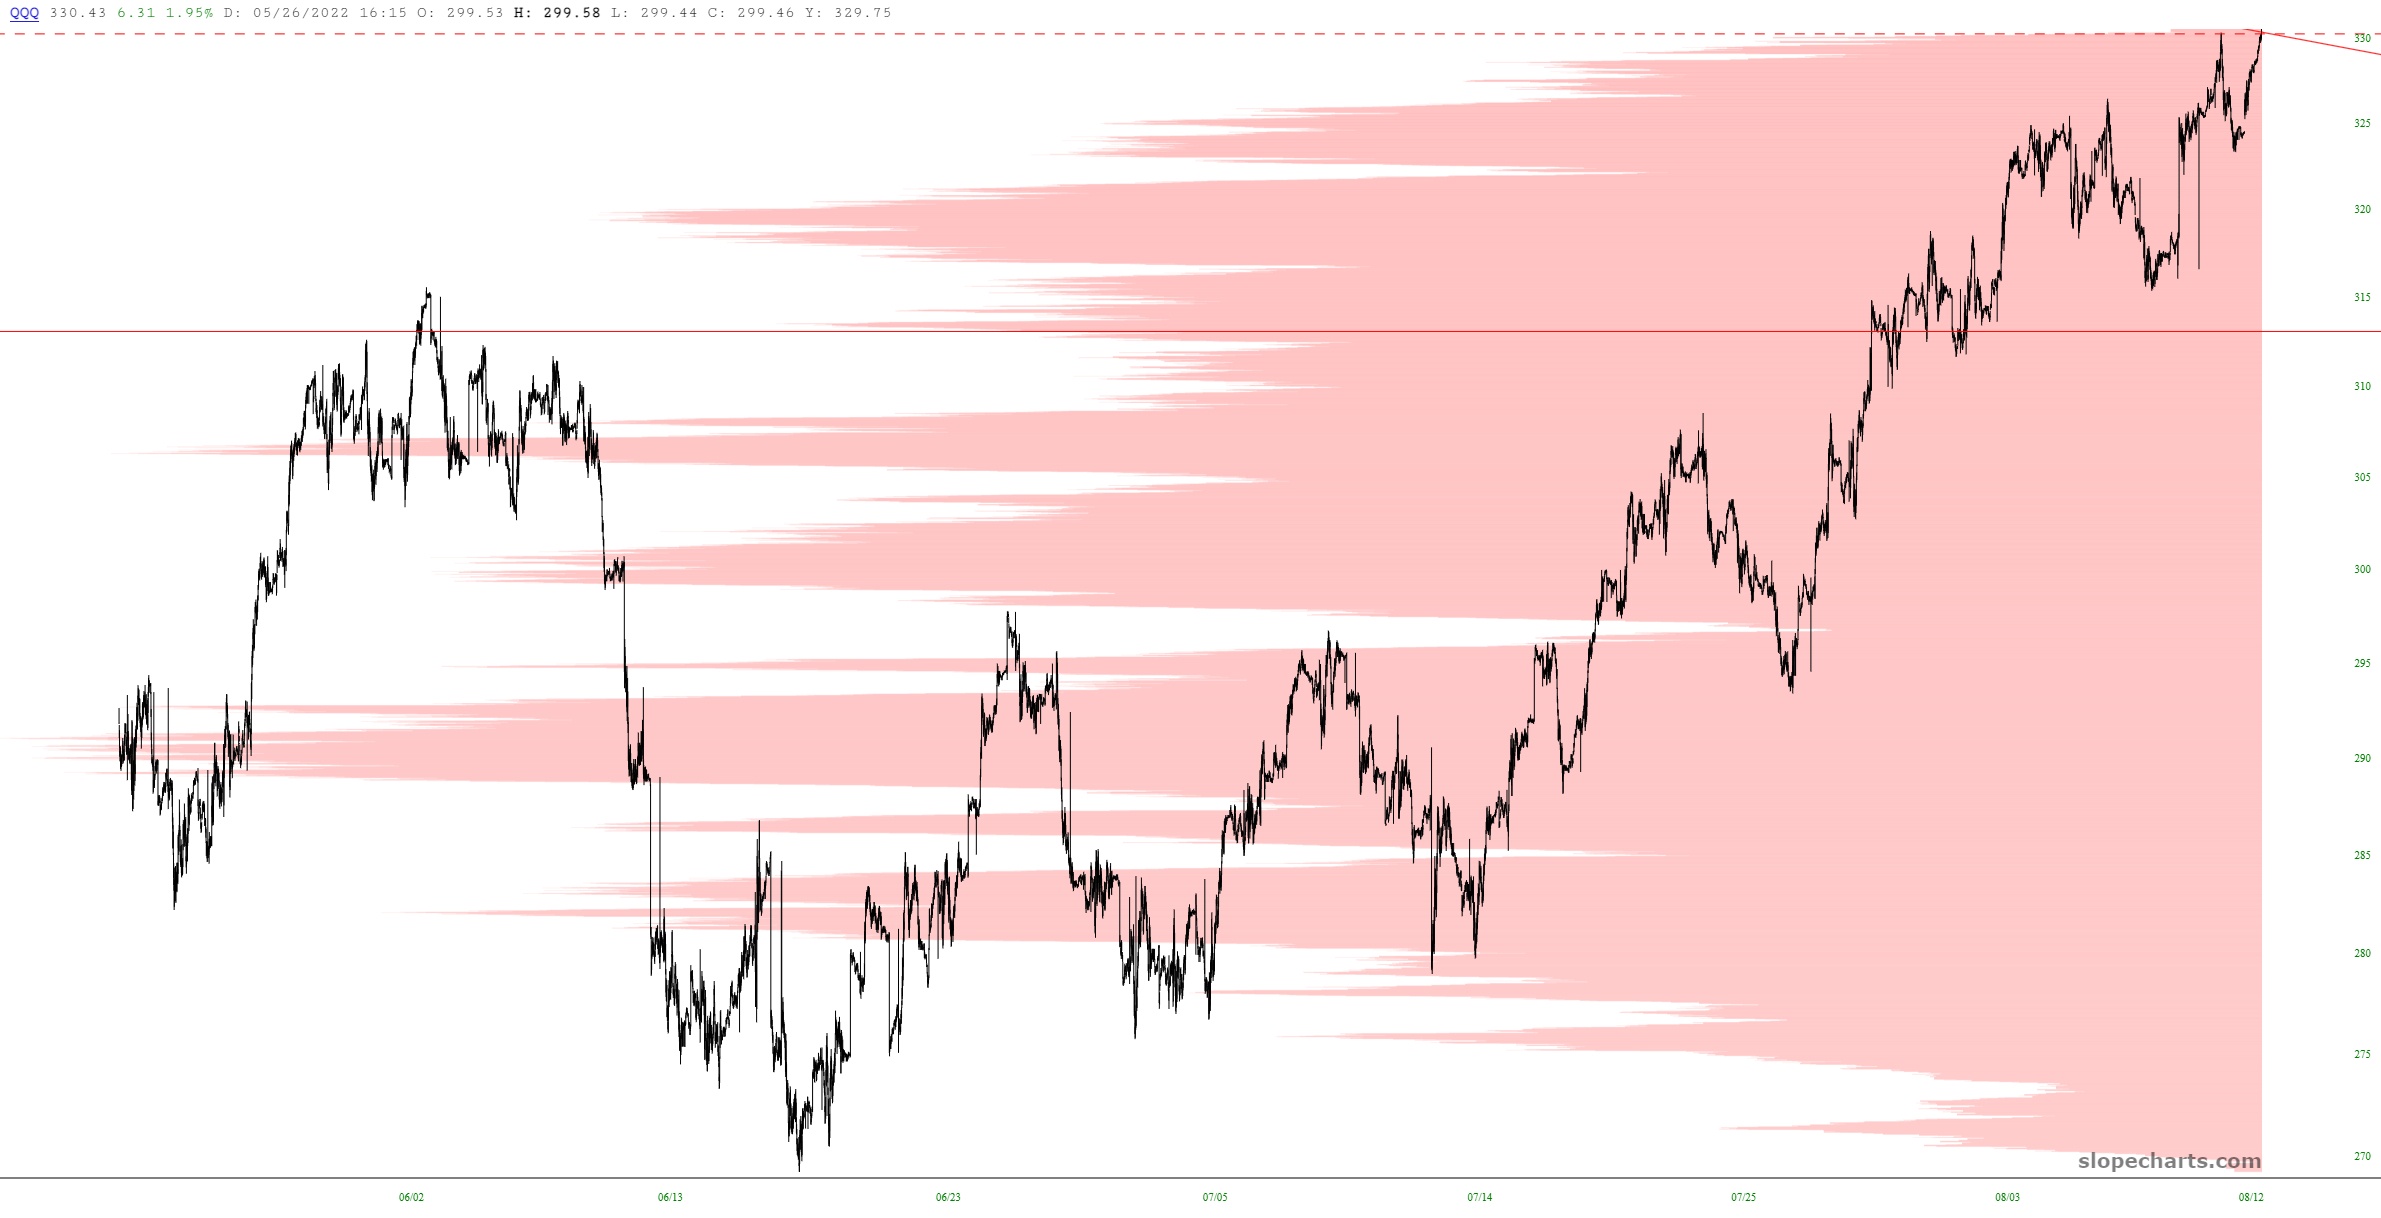
As another example, here is the QQQ with 60 days of intraday data. I’ve used a different color and side just to show the difference in appearance.
I hope you enjoy this new feature, and I look forward to your feedback!
