Hello there from the East Coast. It’s about 3:30 in the morning here, Palo Alto time (to which I’m still anchored), so I thought I’d once again take keyboard in hand and share my brief thoughts on nine important ETF charts, after Monday’s wonderful tumble. I’ve put my comments in the caption section beneath each clickable chart.
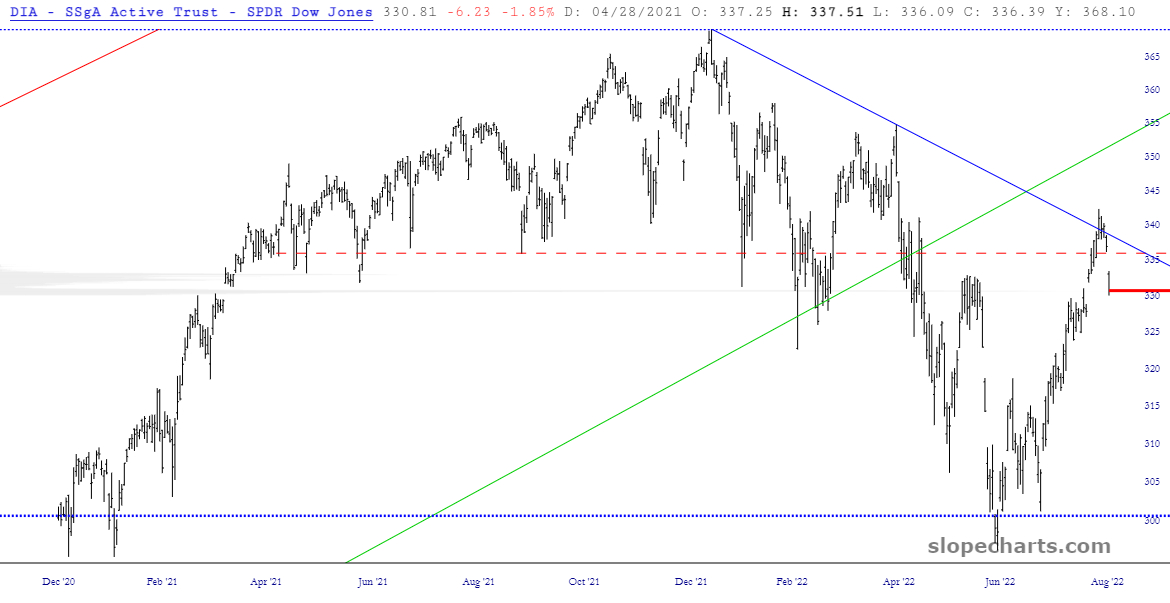
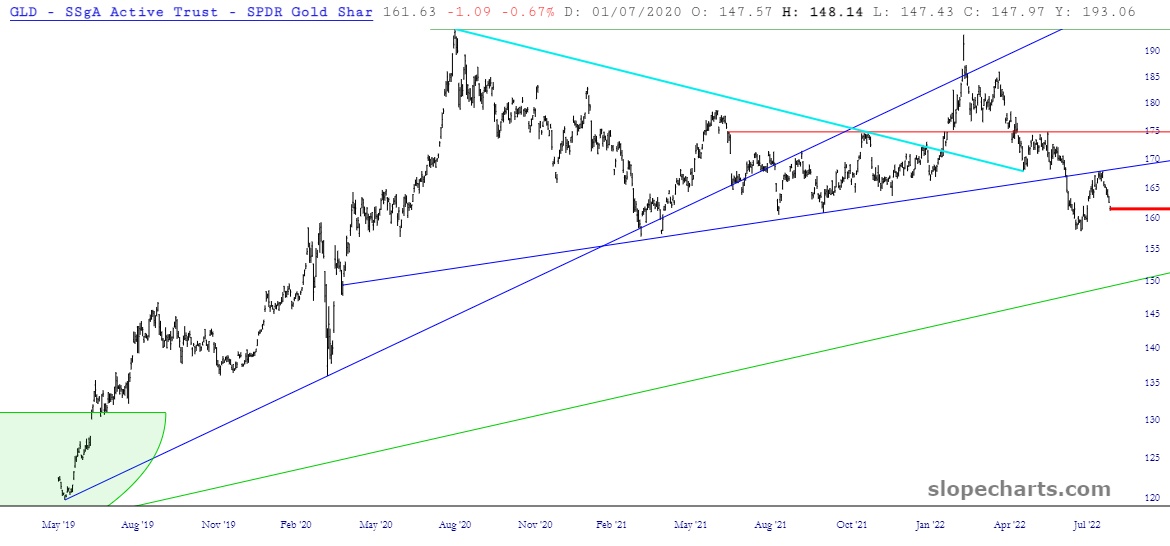
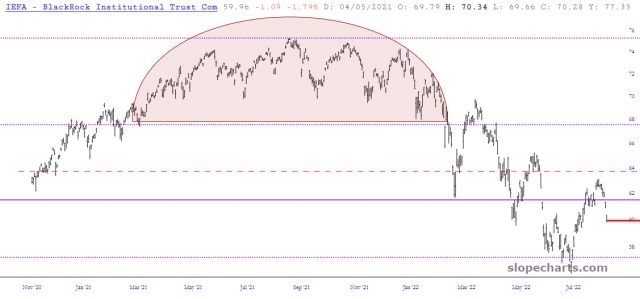
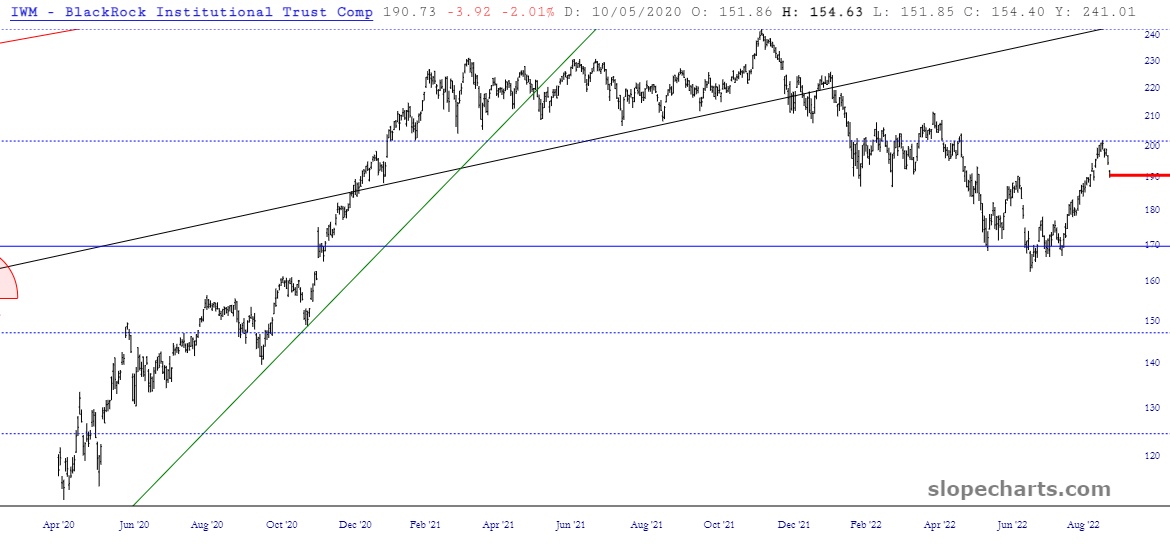
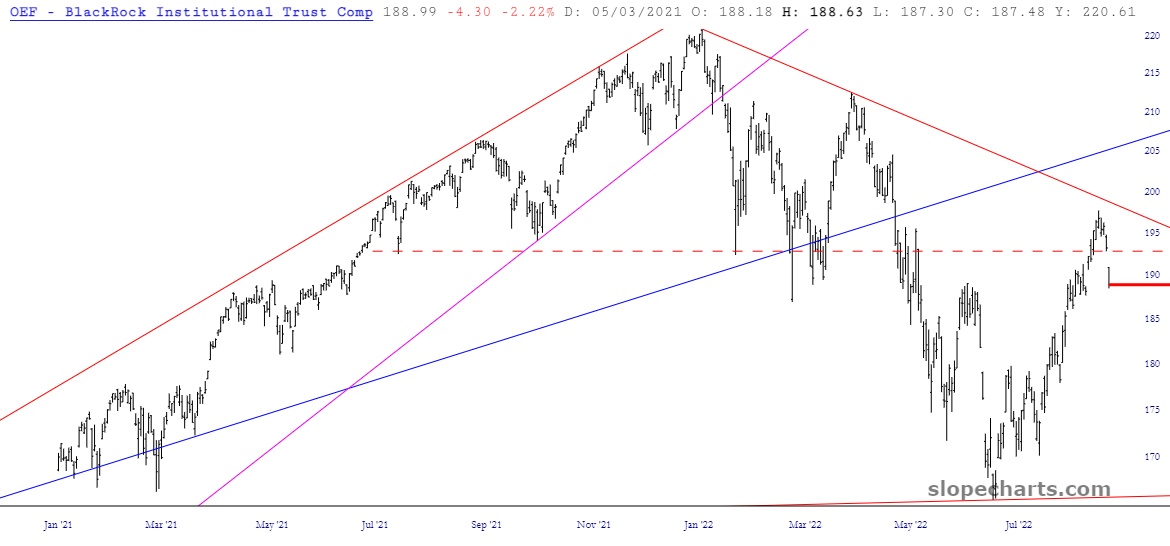
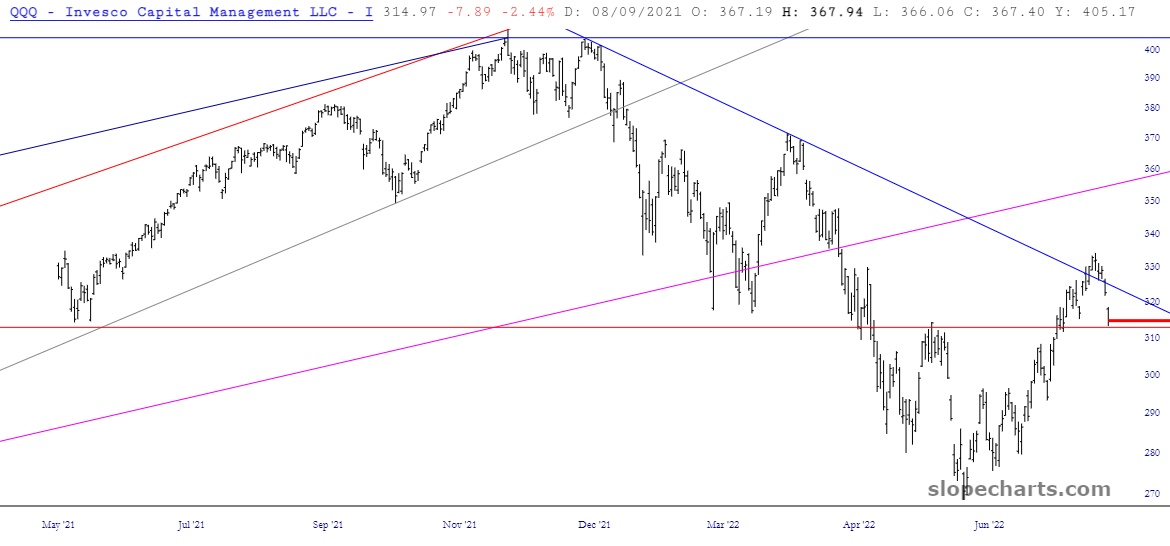
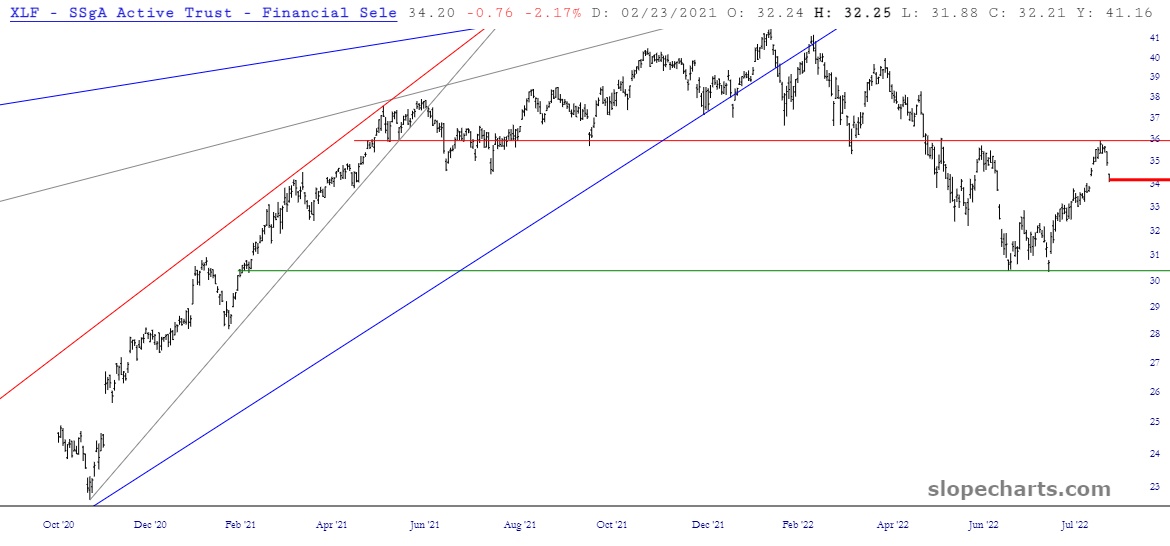
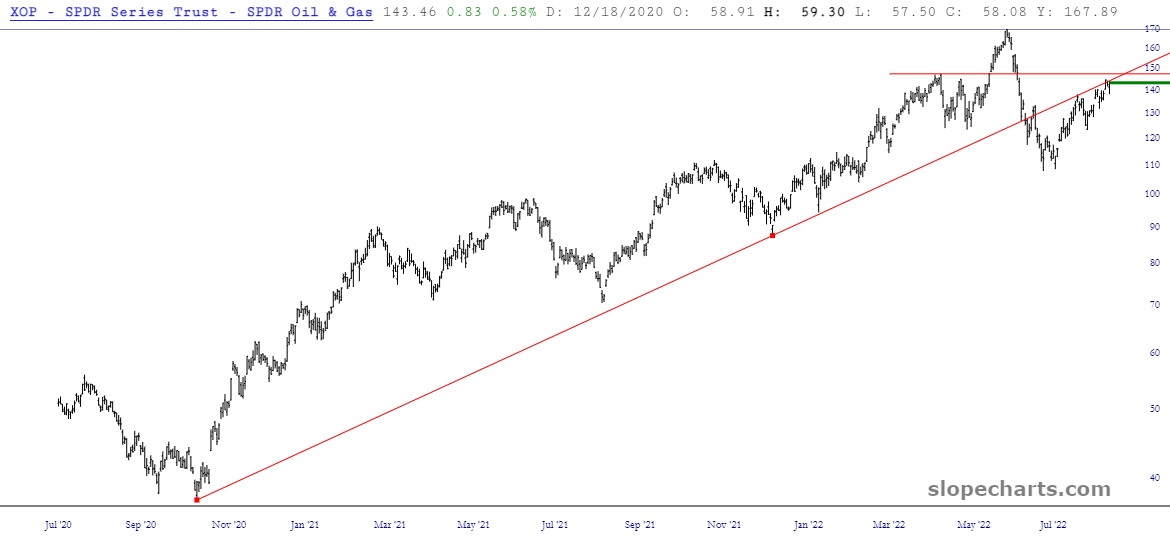
DIA: The Dow “diamonds” broke above their resistance trendline last week, but thank God, that’s a moot point now. This was a failed bullish breakout, and just like about everything tradeable entity, there’s a big, beautiful price gap now.GLD – I’ve stopped messing with gold, because it always, always, always disappoints me. So, as I watch from a safe distance, it’s doing precisely what I anticipated which is retracing back to that broken blue trendline and then resuming its tumble.IEFA – global equities have been following a steady series of lower lows and lower highs. This is a beautiful chart.IWM – I’m also quite pleased with small caps, which were very respectful of their Fibonacci levels.OEF – the S&P 100 ETF reached for, but failed to meet, its resistance trendline.QQQ – the NASDAQ 100 stocks pushed above their resisting trendline last week but, as with several other major ETFs, it gave that up in a failed bullish breakout. It is presently teetering at a major Fibonacci support level.XLF – financial stocks topped out nicely and are turning away from the same early June resistanceXOP – oil stocks are being torn between, on the one hand, a potential Iran deal (bad for oil prices) and, on the other, Saudi jaw-boning about cutting back supply (good for oil prices). From a charting perspective, it’s getting pretty close to a make-or-break point for the bears, since one more strong day would cause real harm to this setup.
My present positioning is twenty-seven January 2023 individual equity puts and three October 2022 ETF puts (SMH, SPY, IYR).