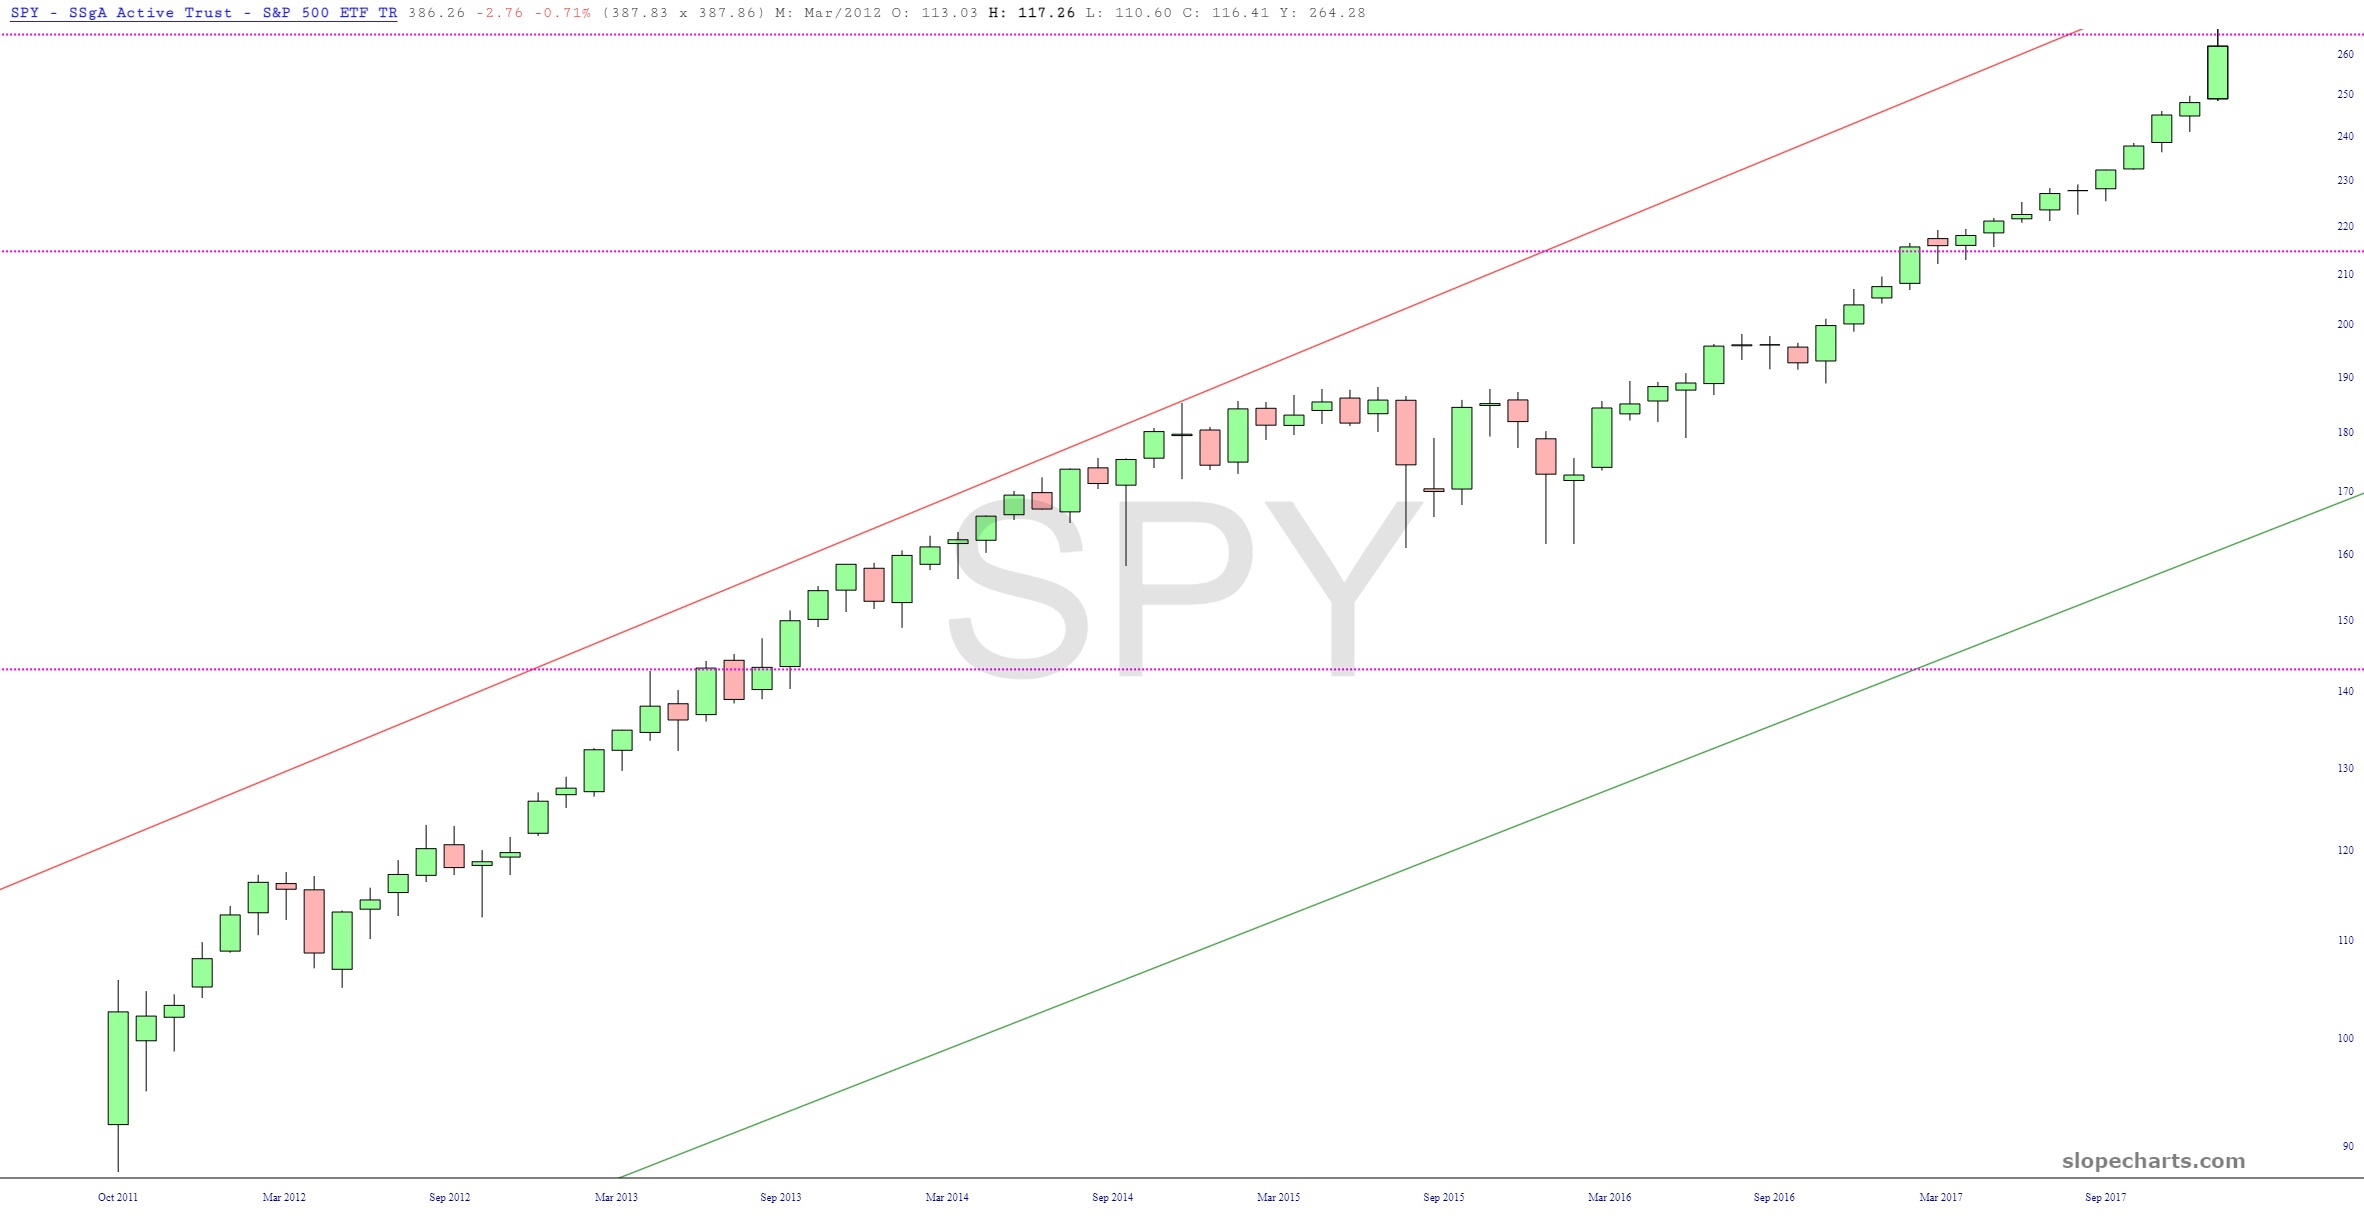
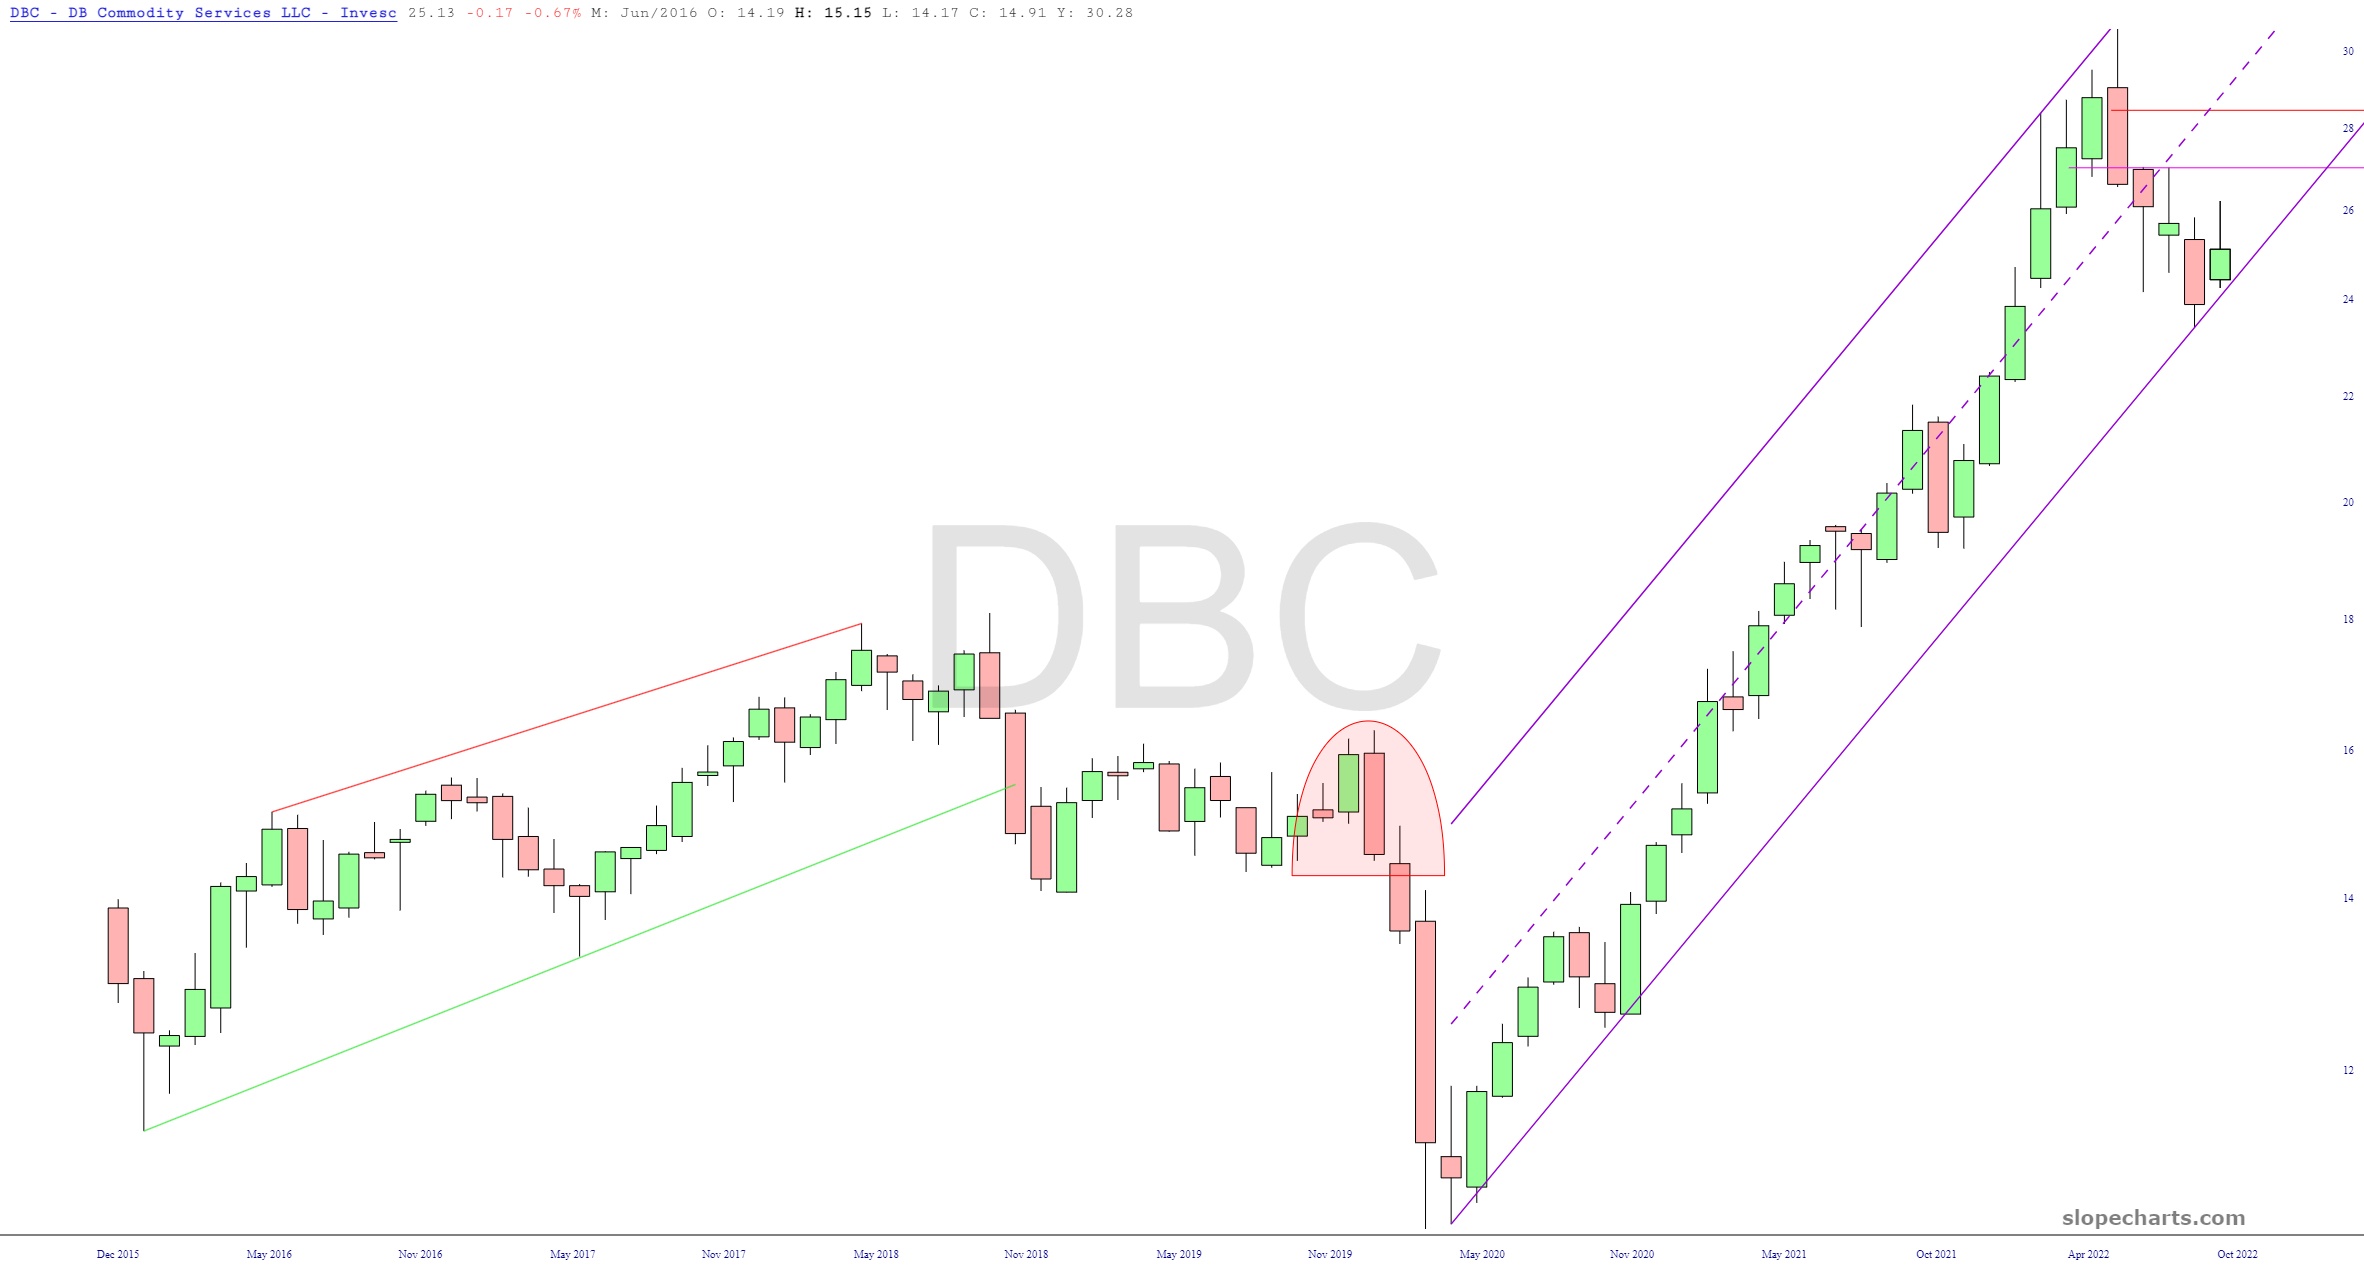
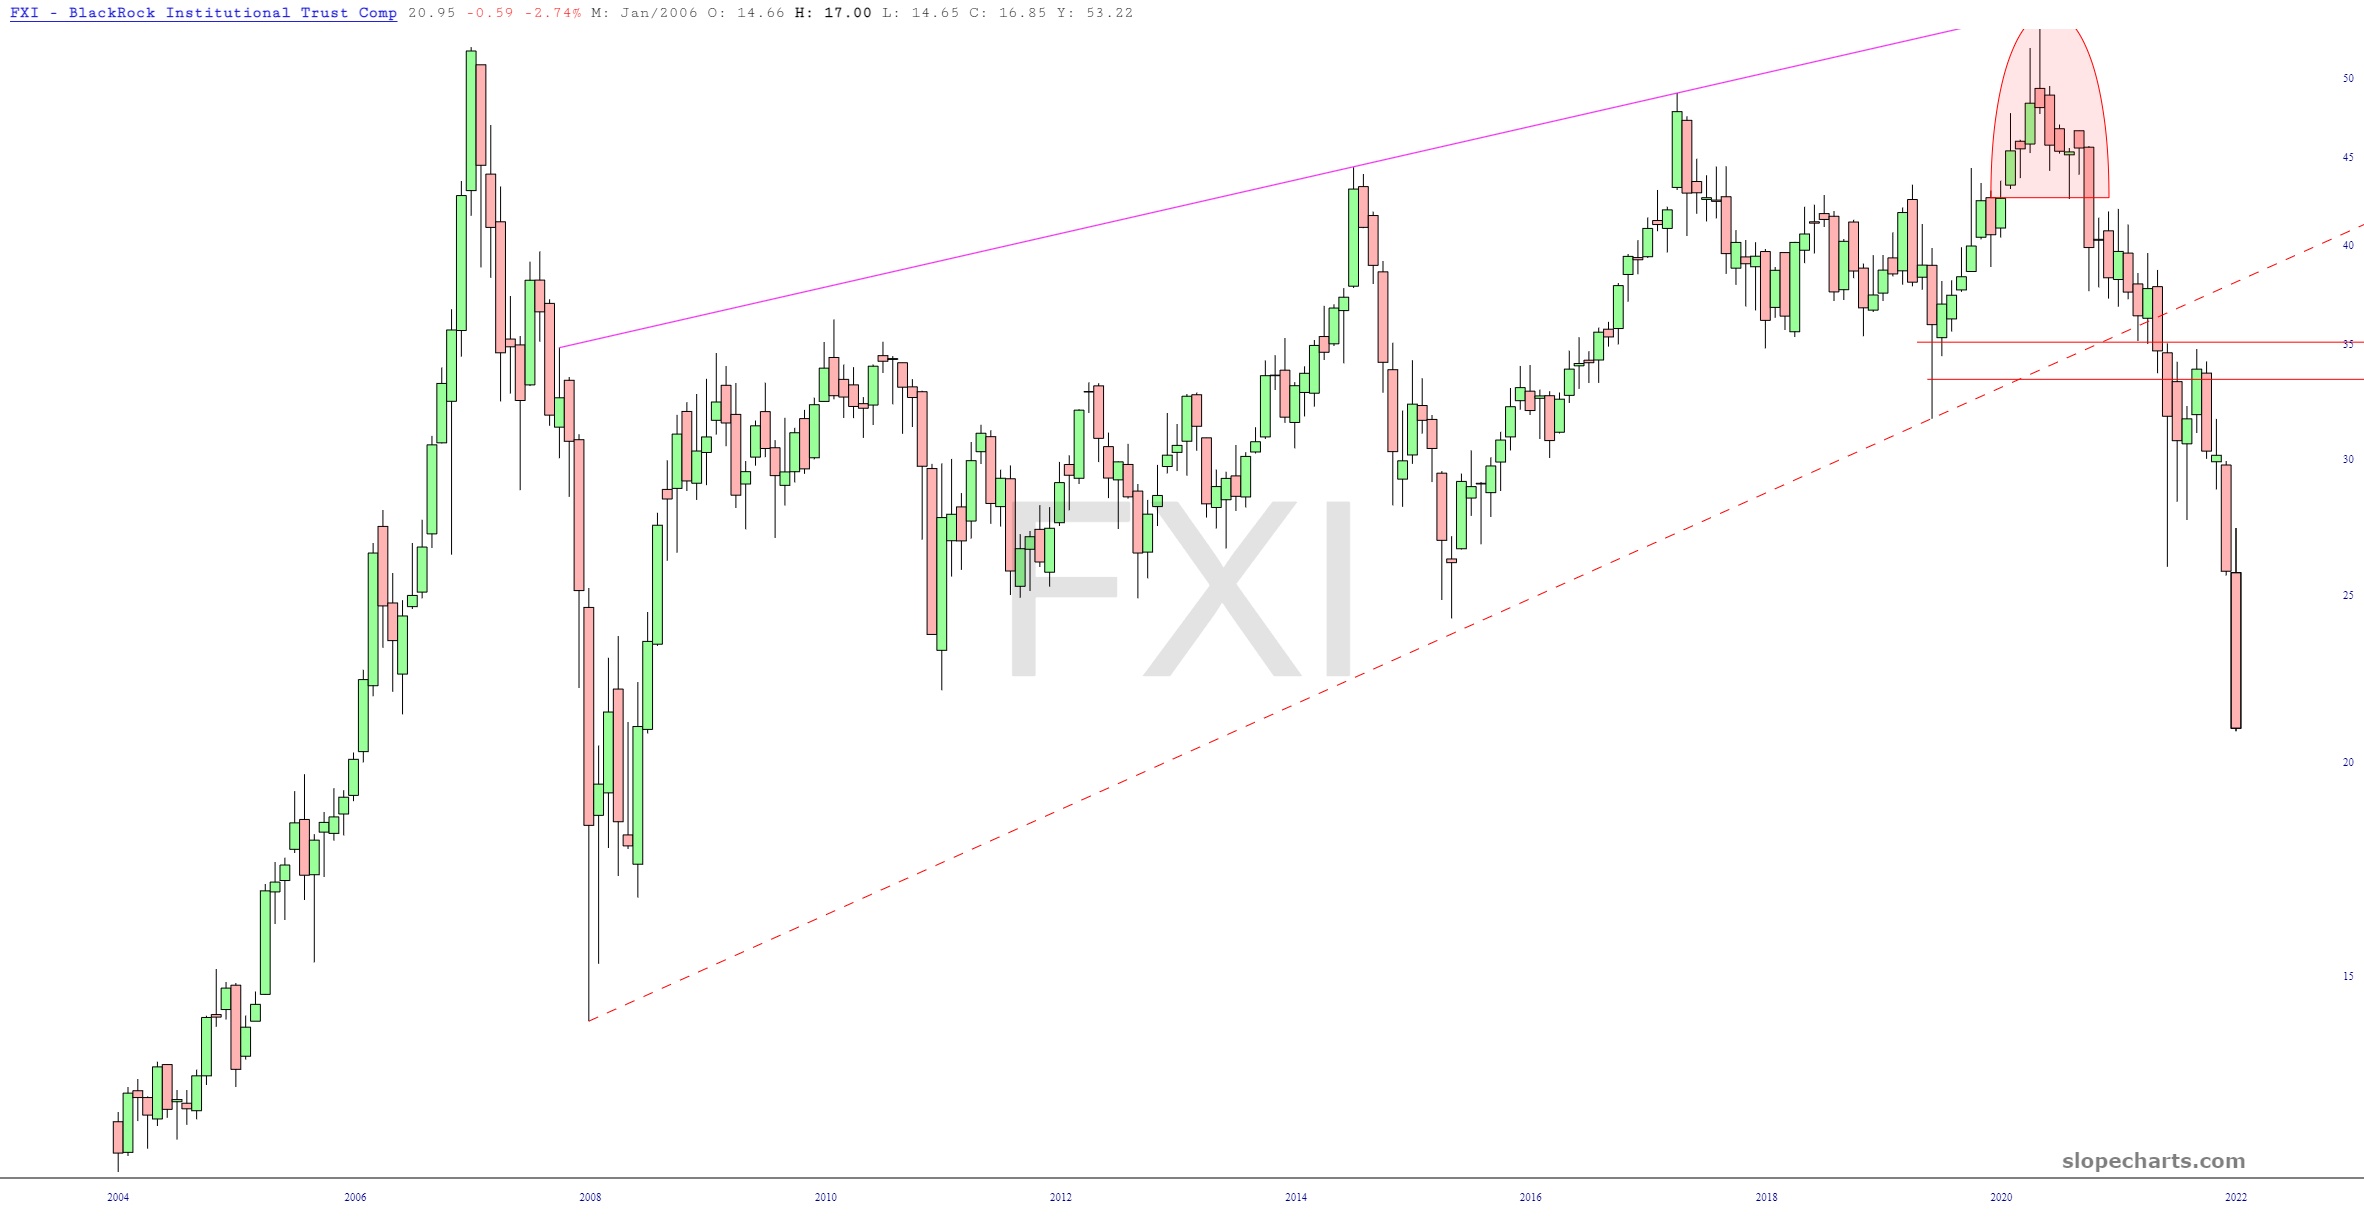
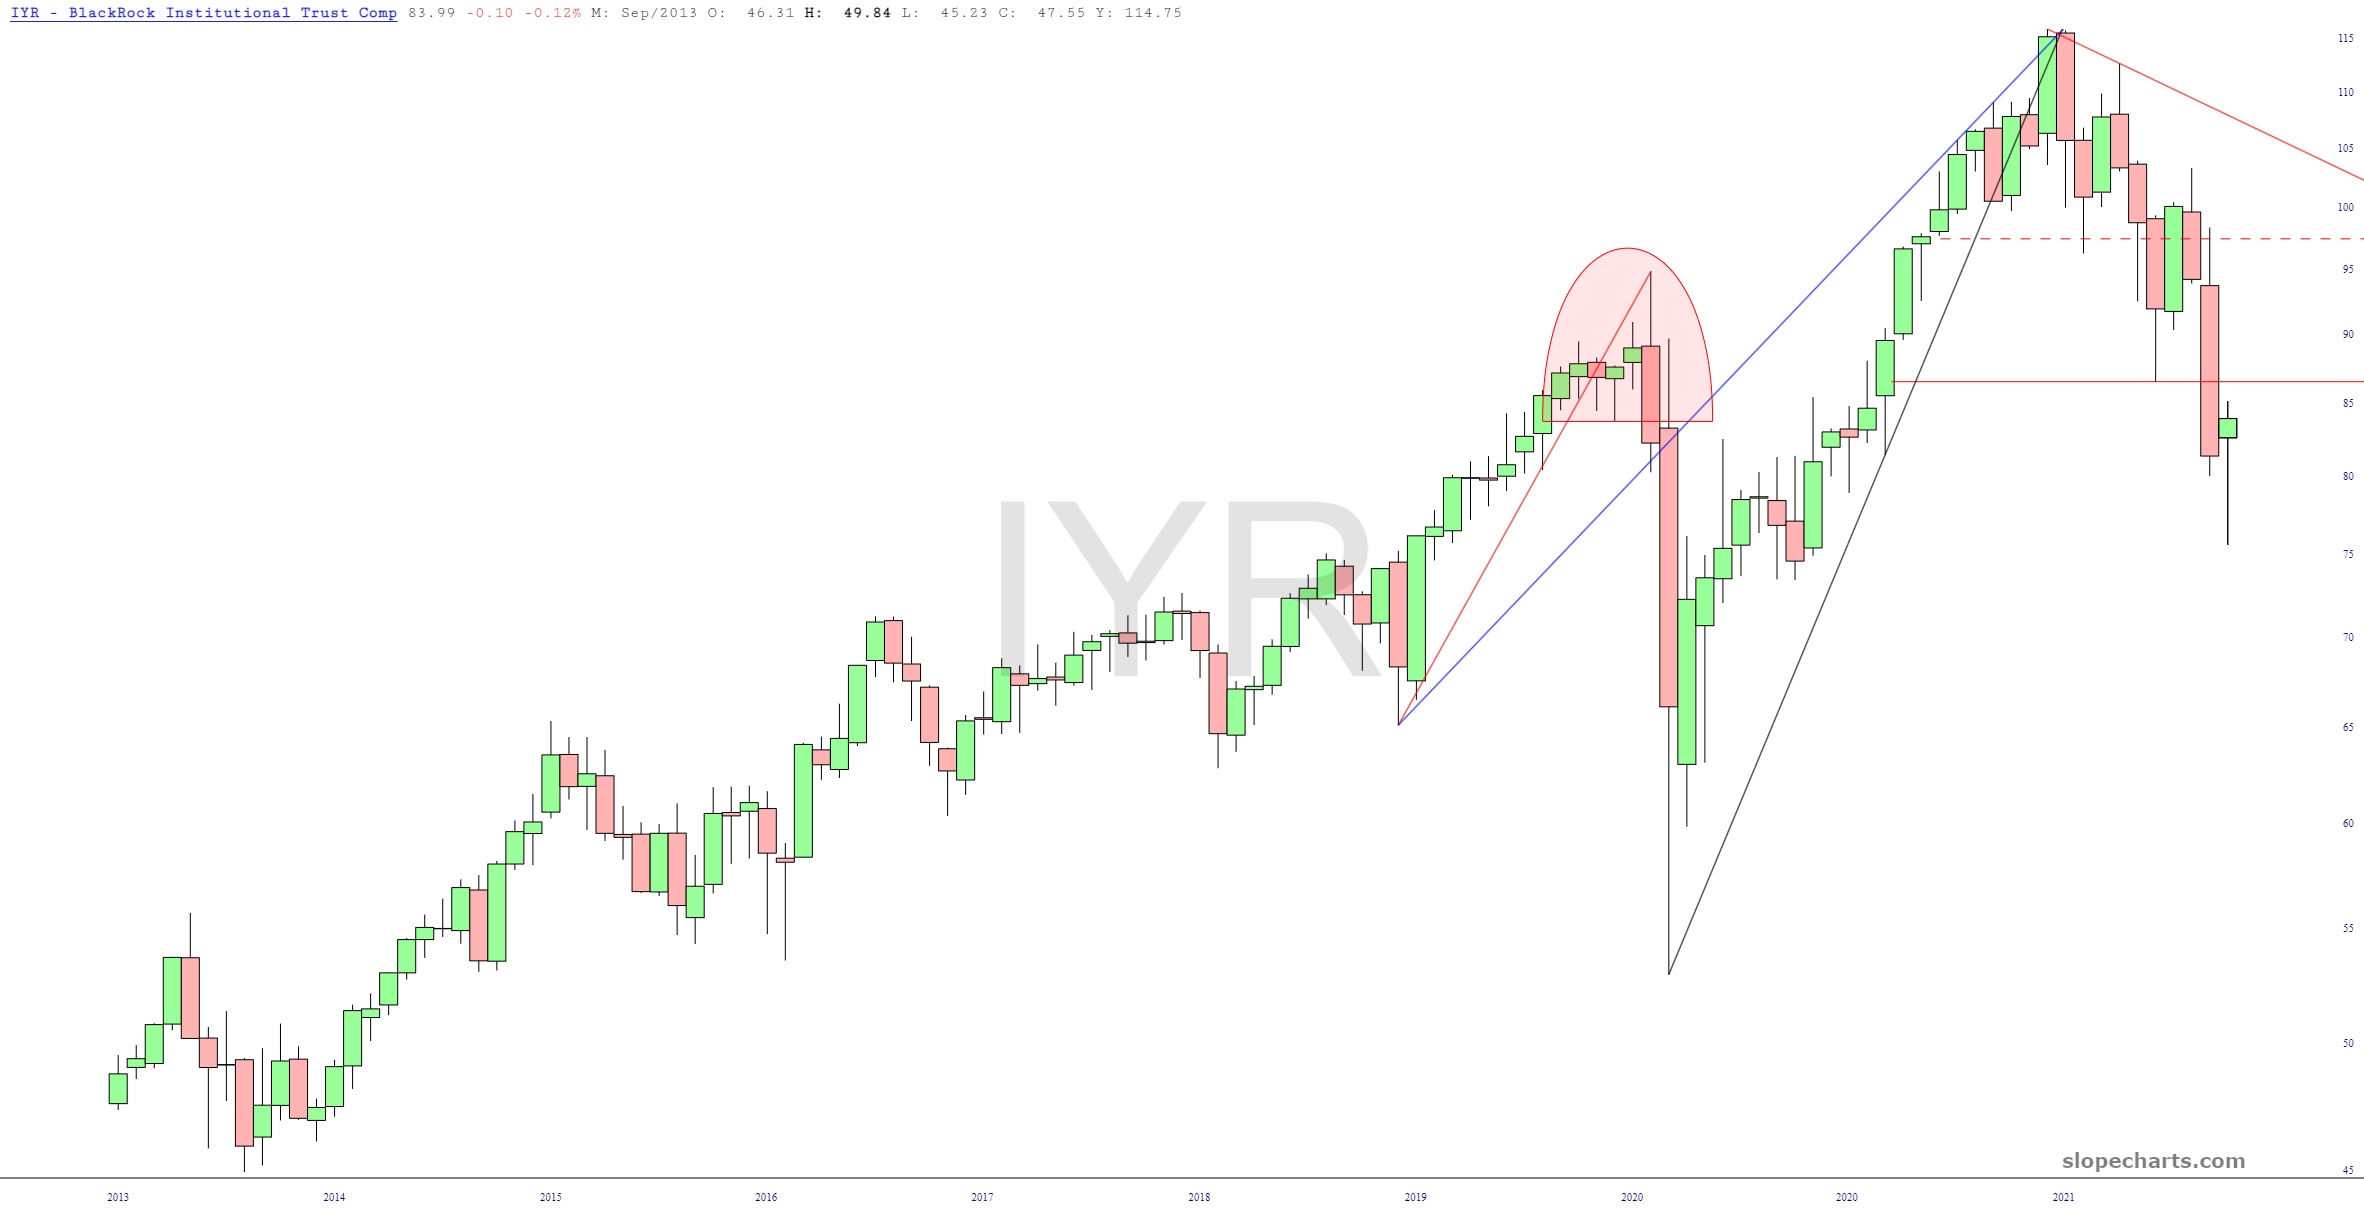
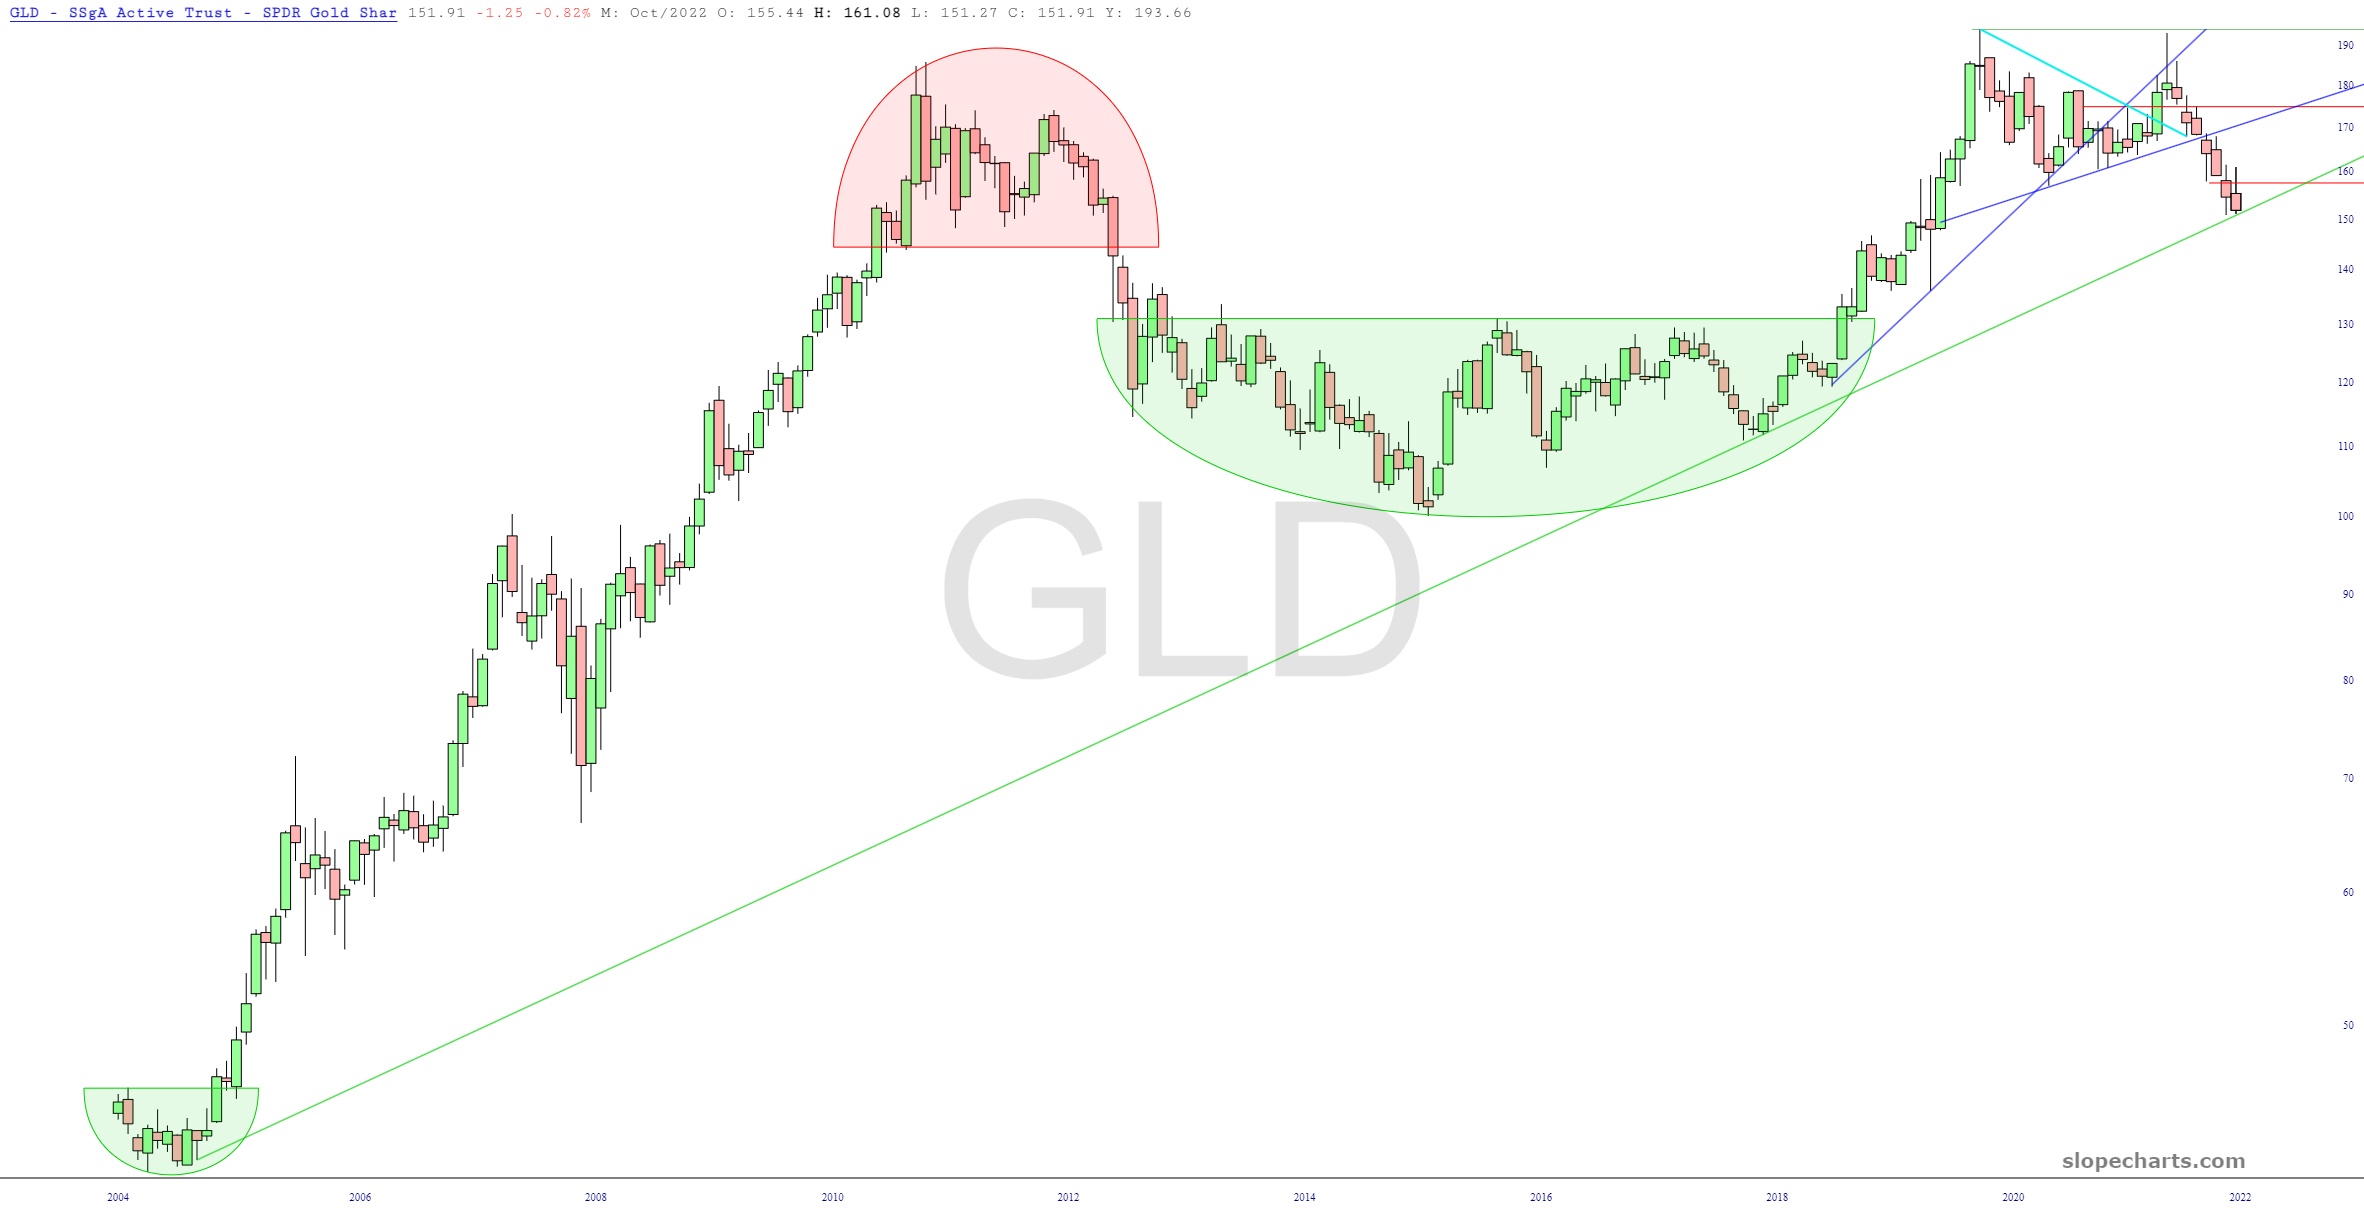
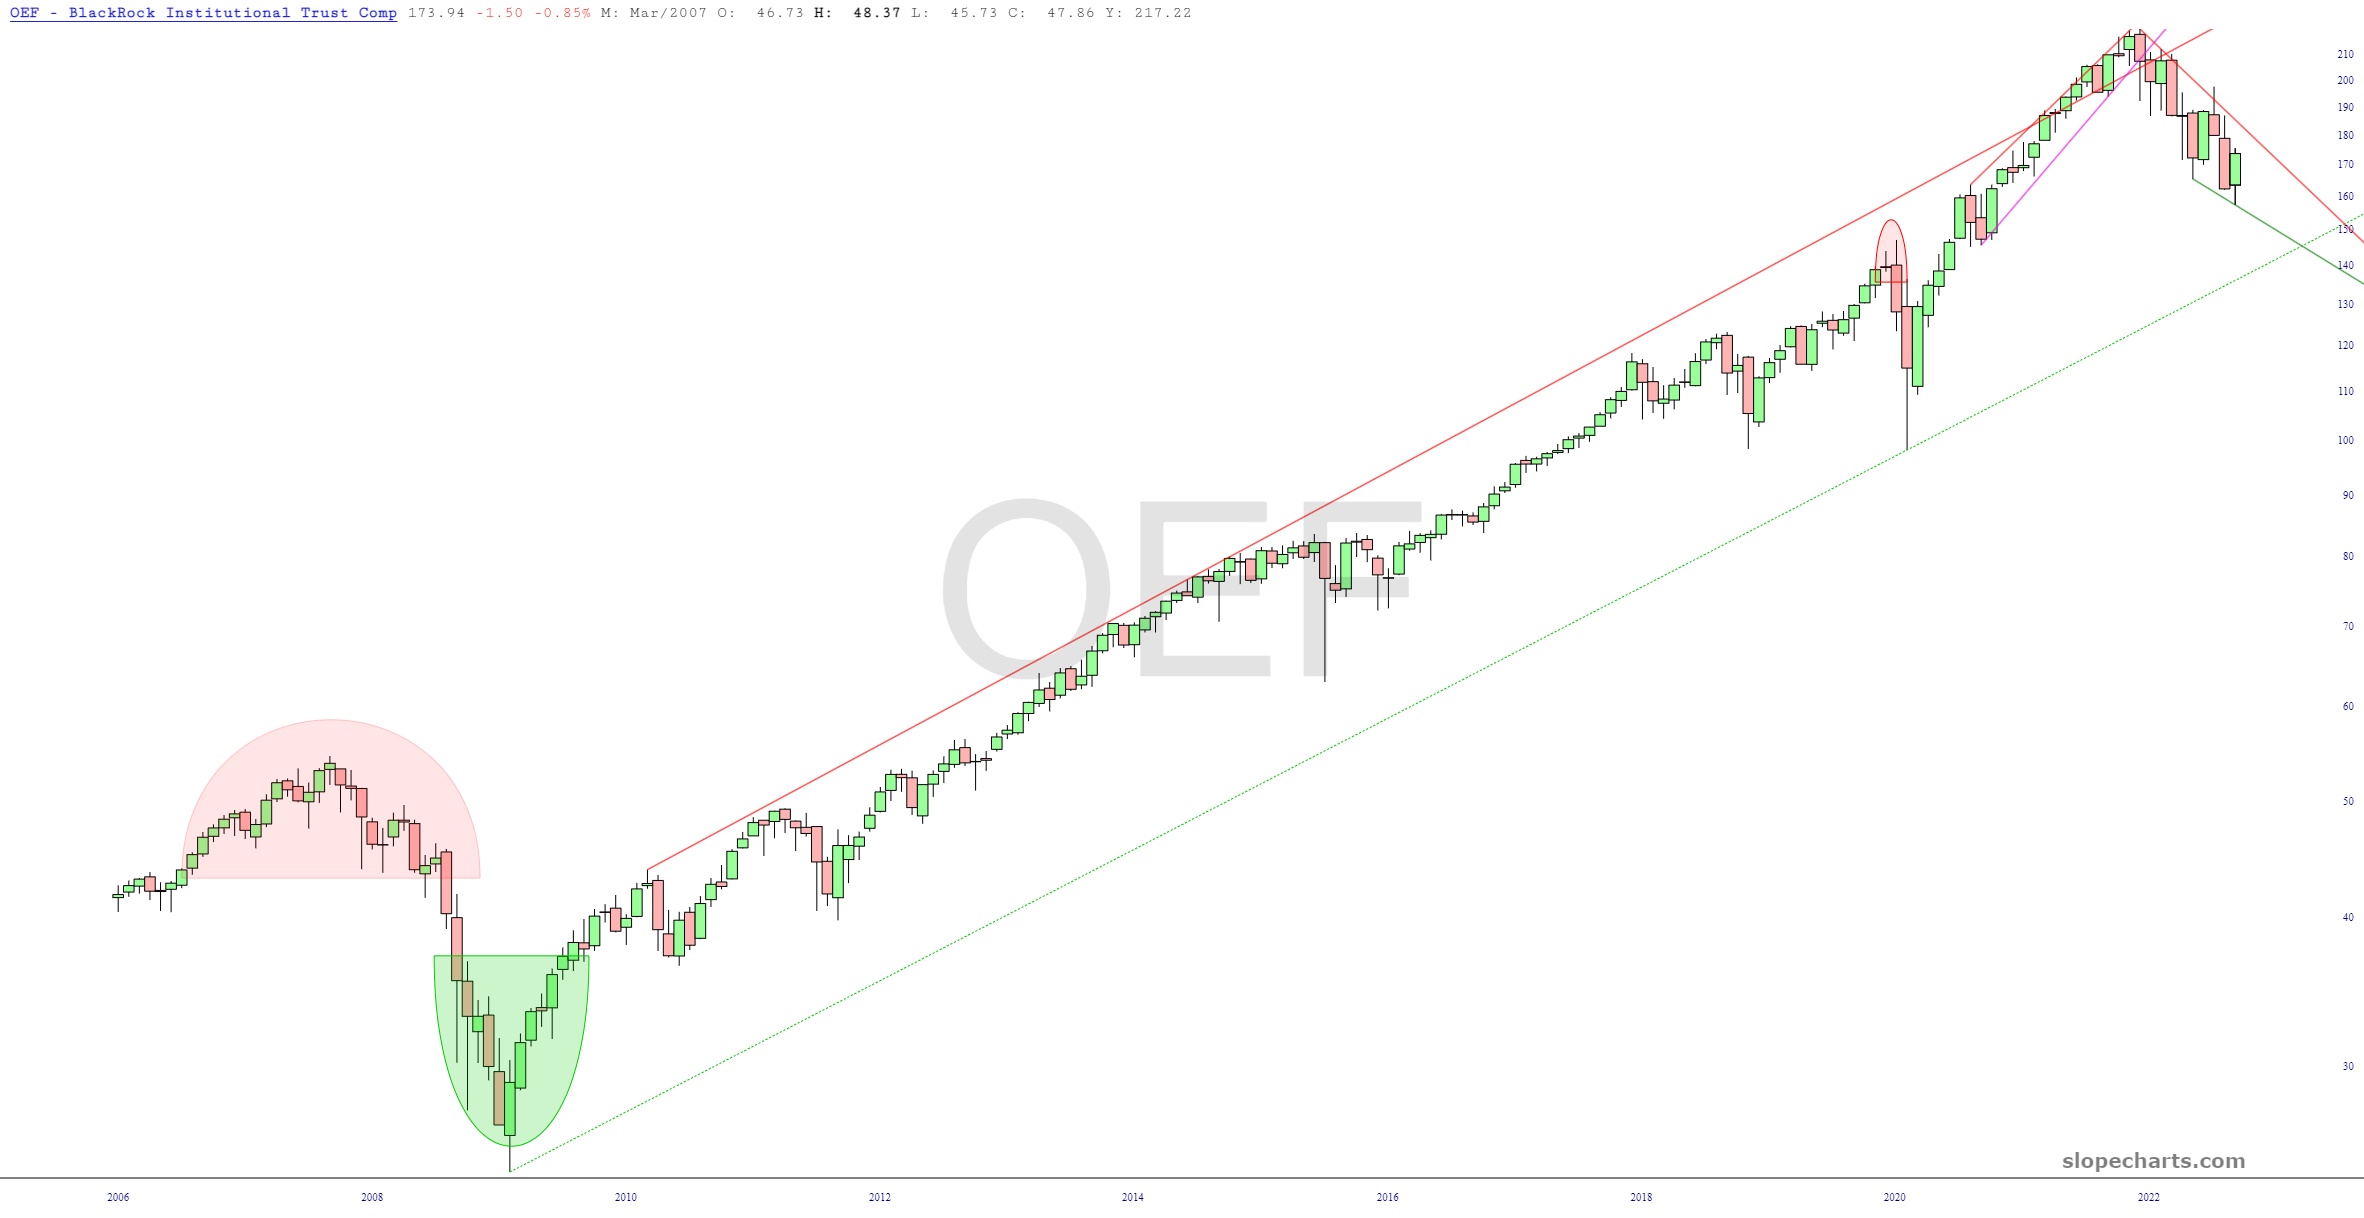
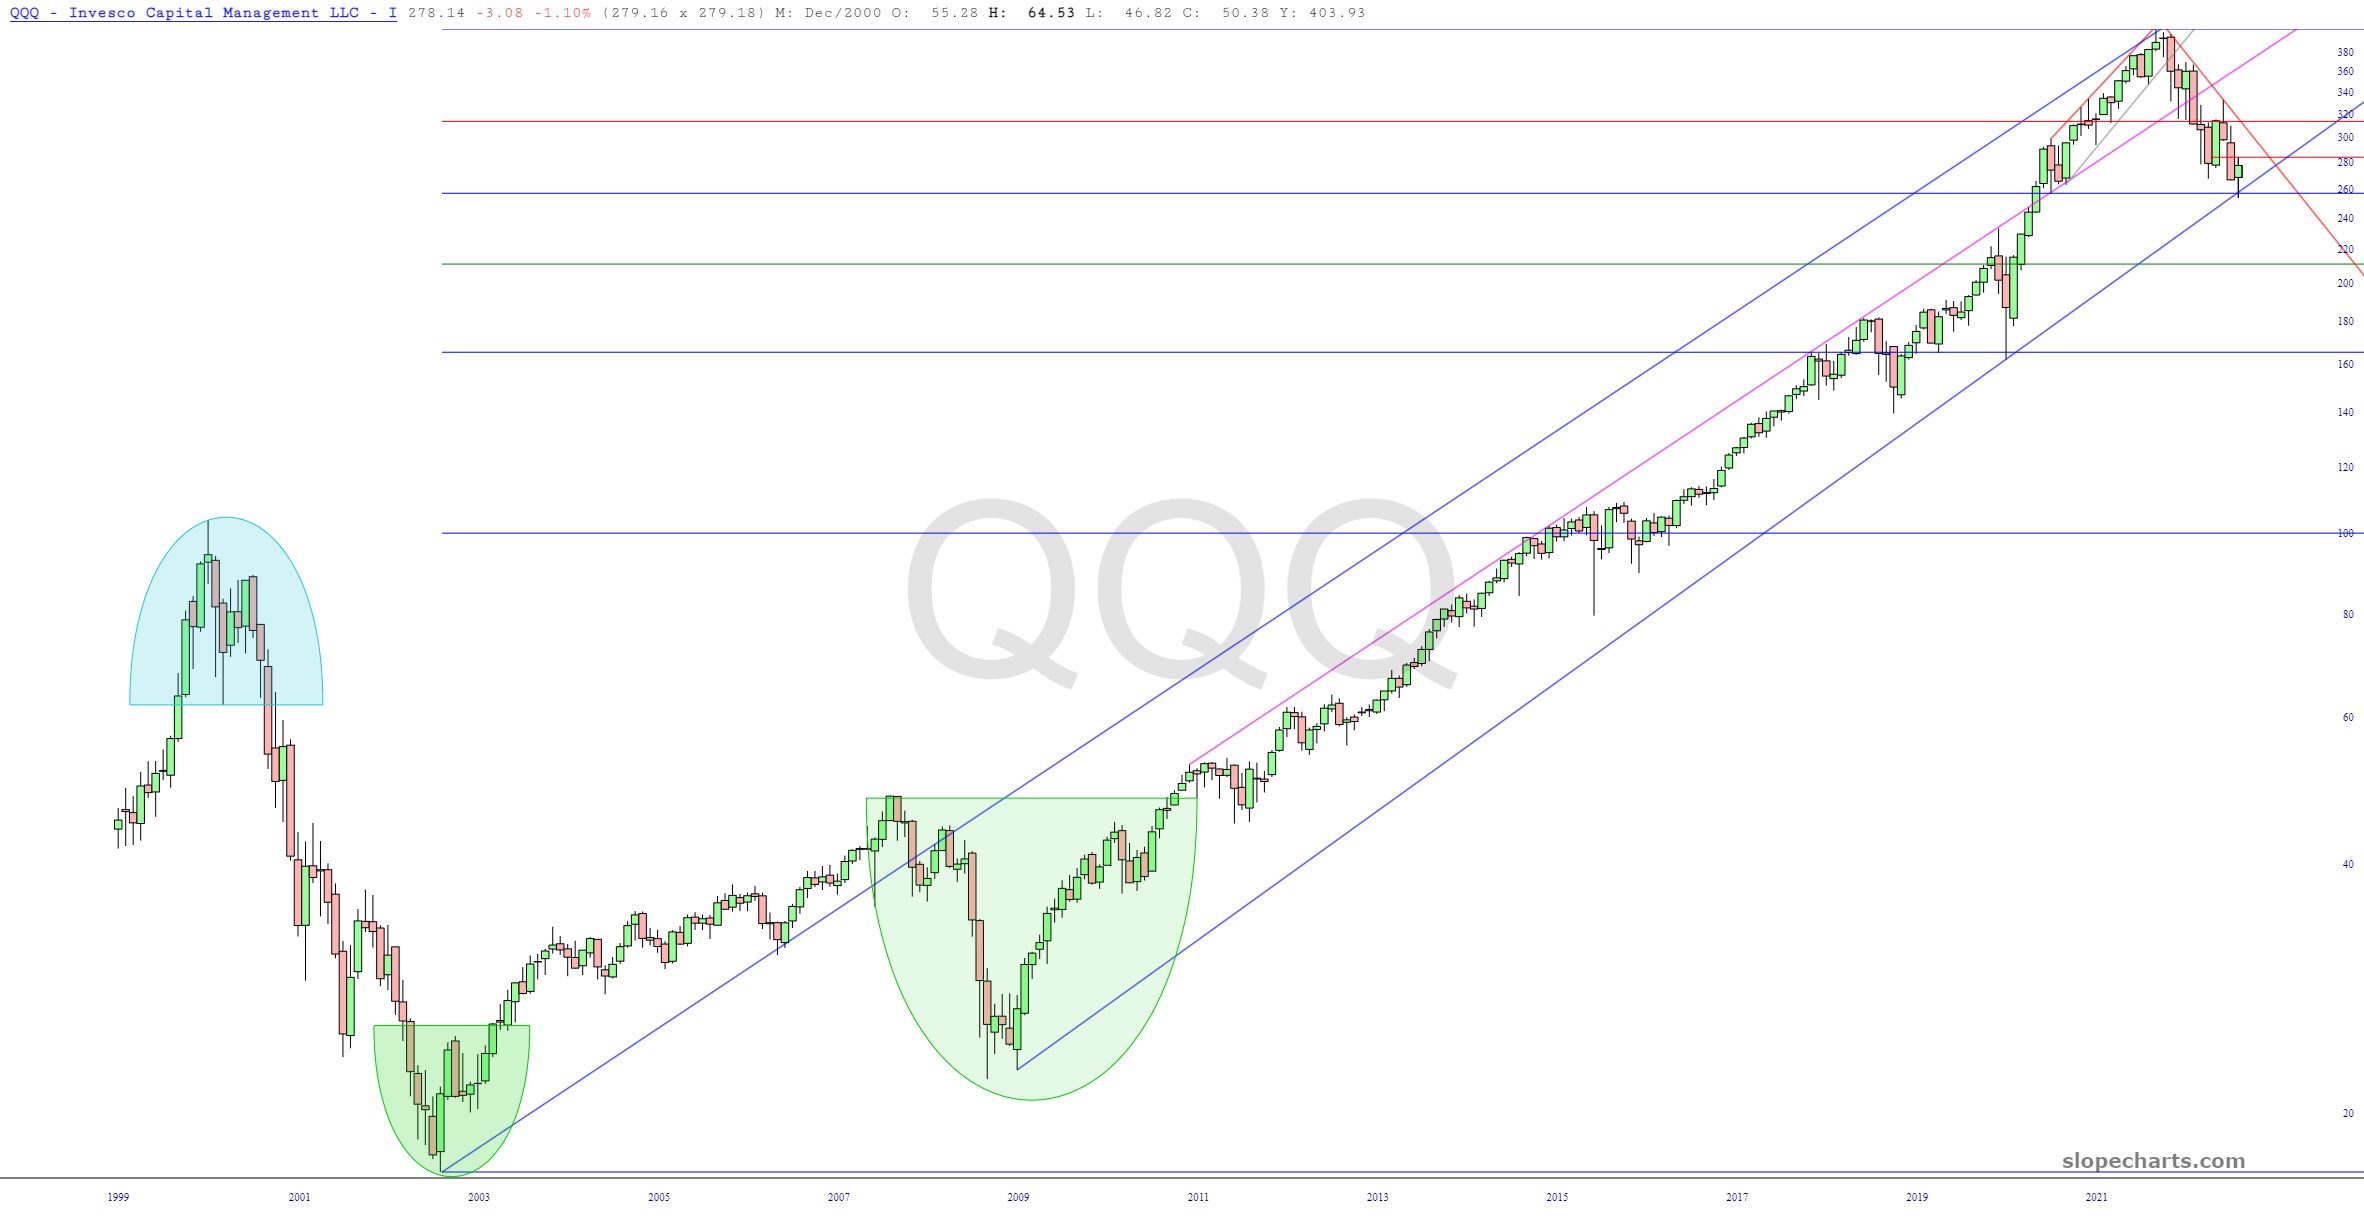
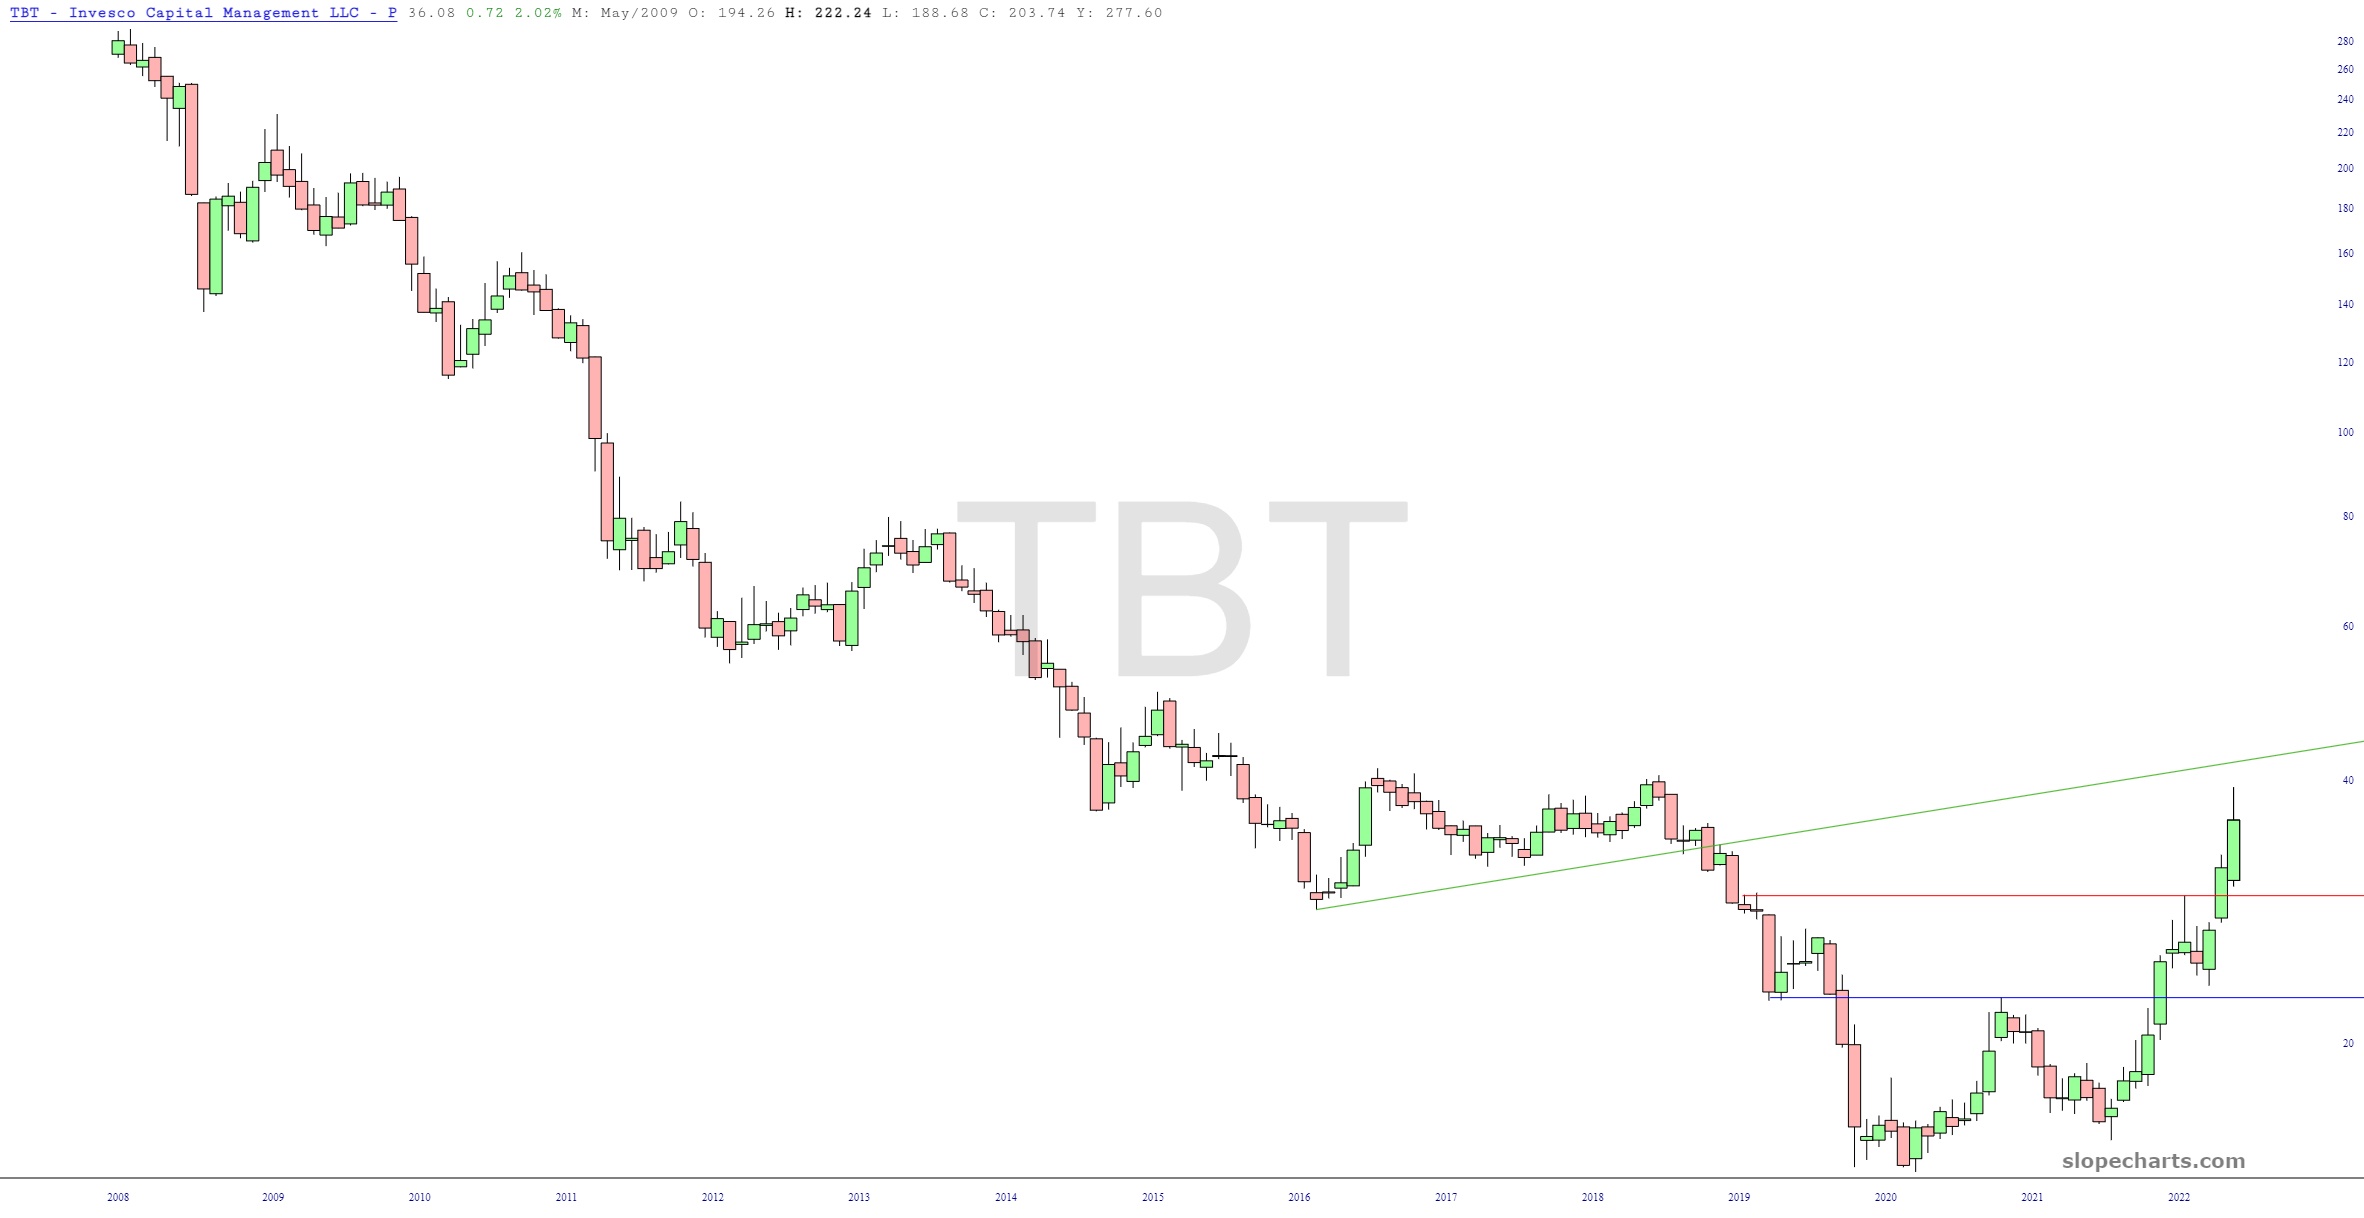
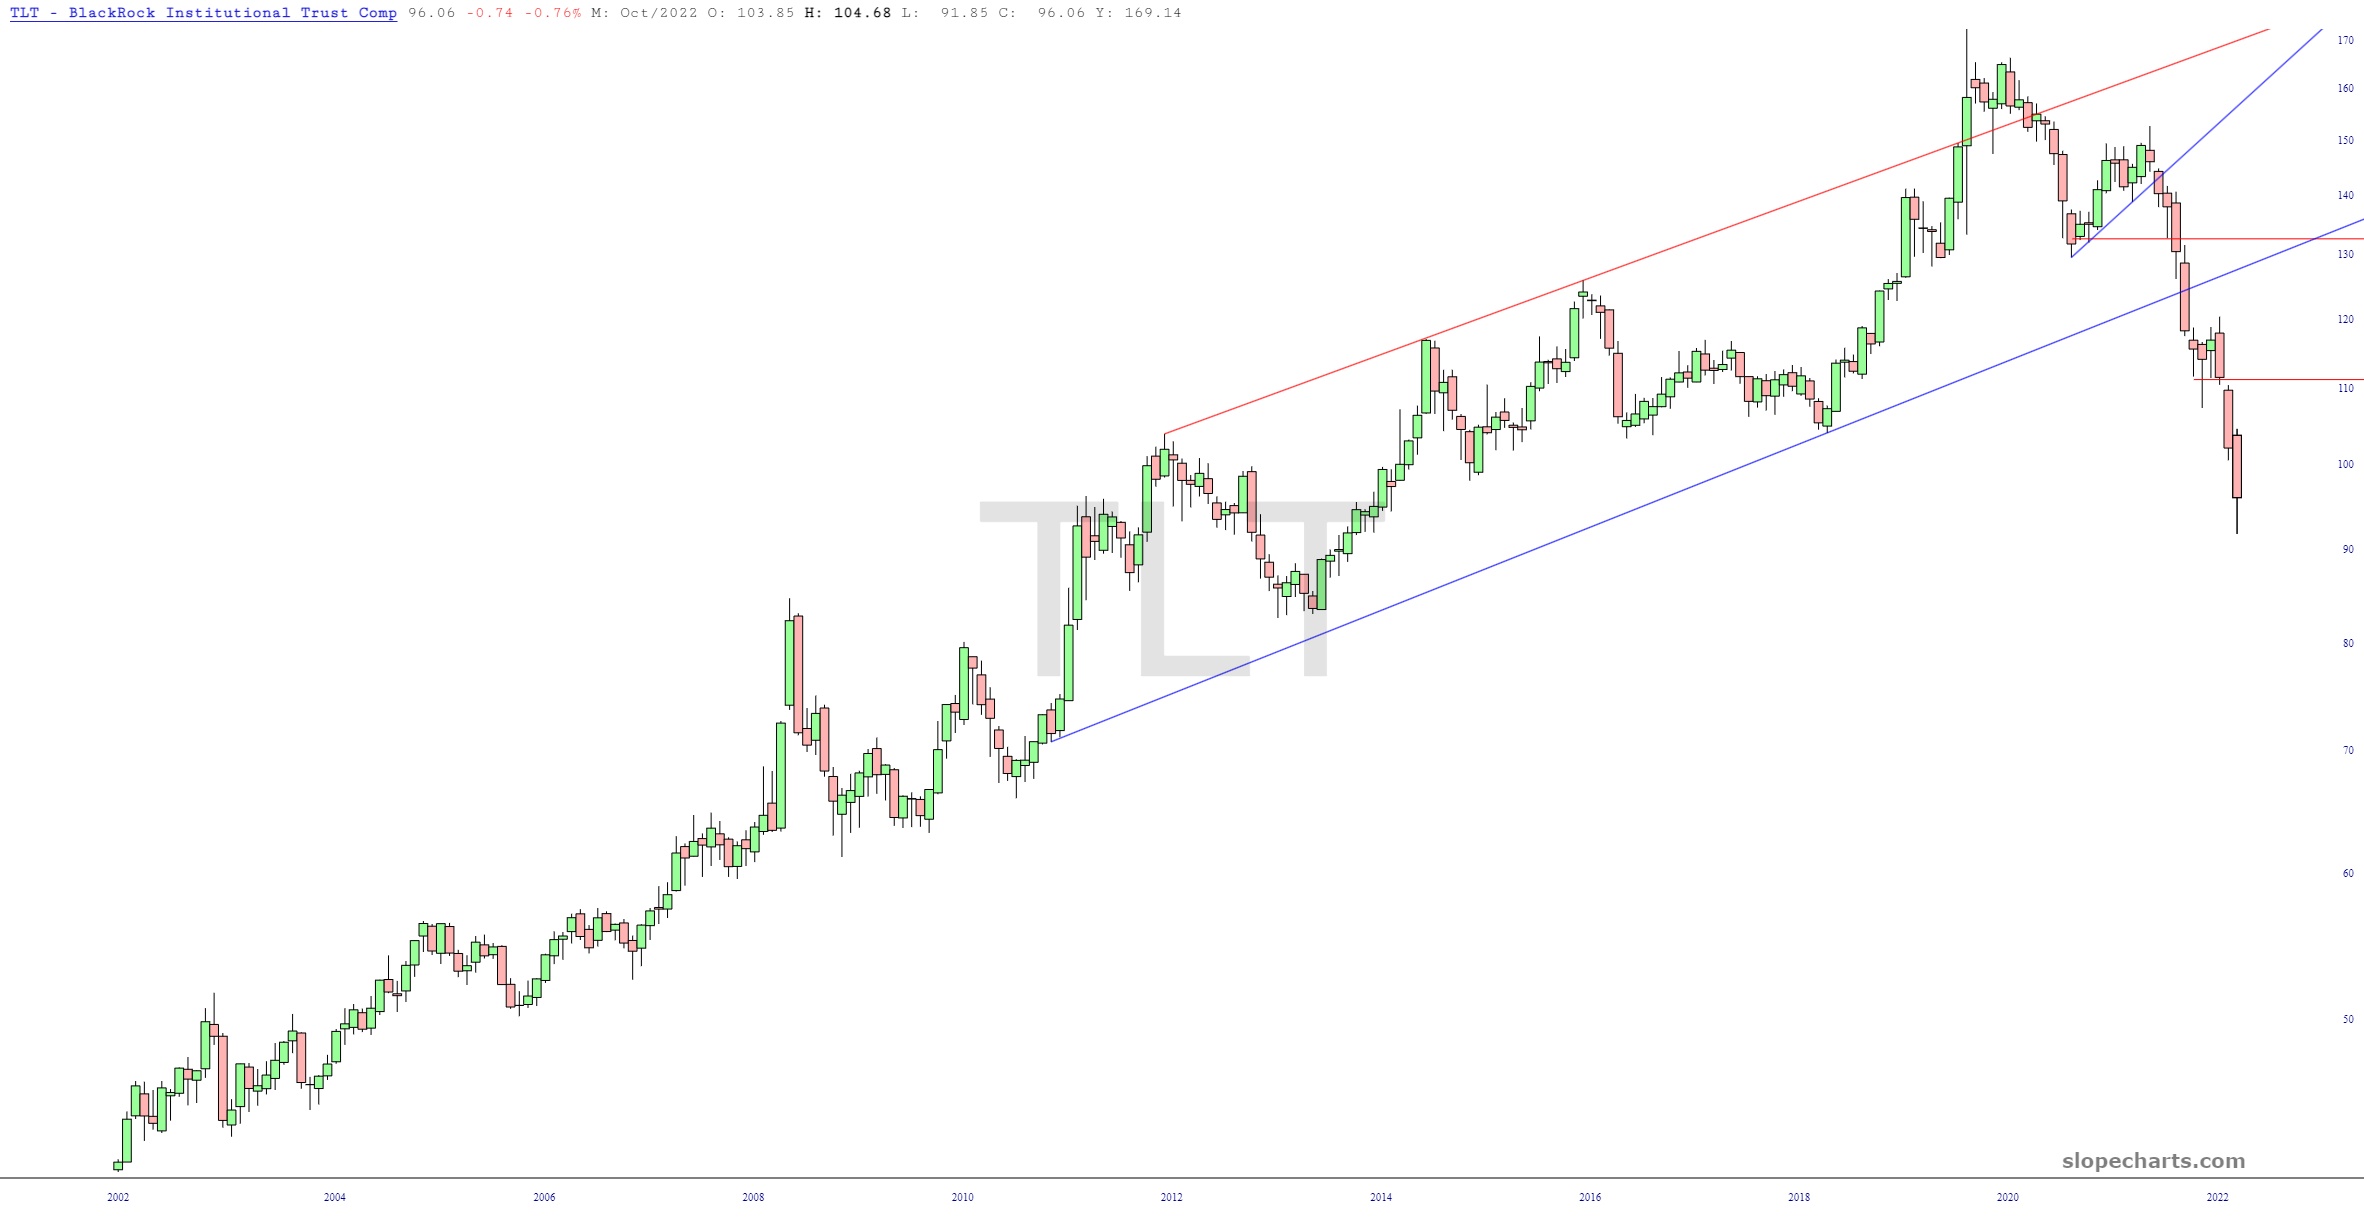
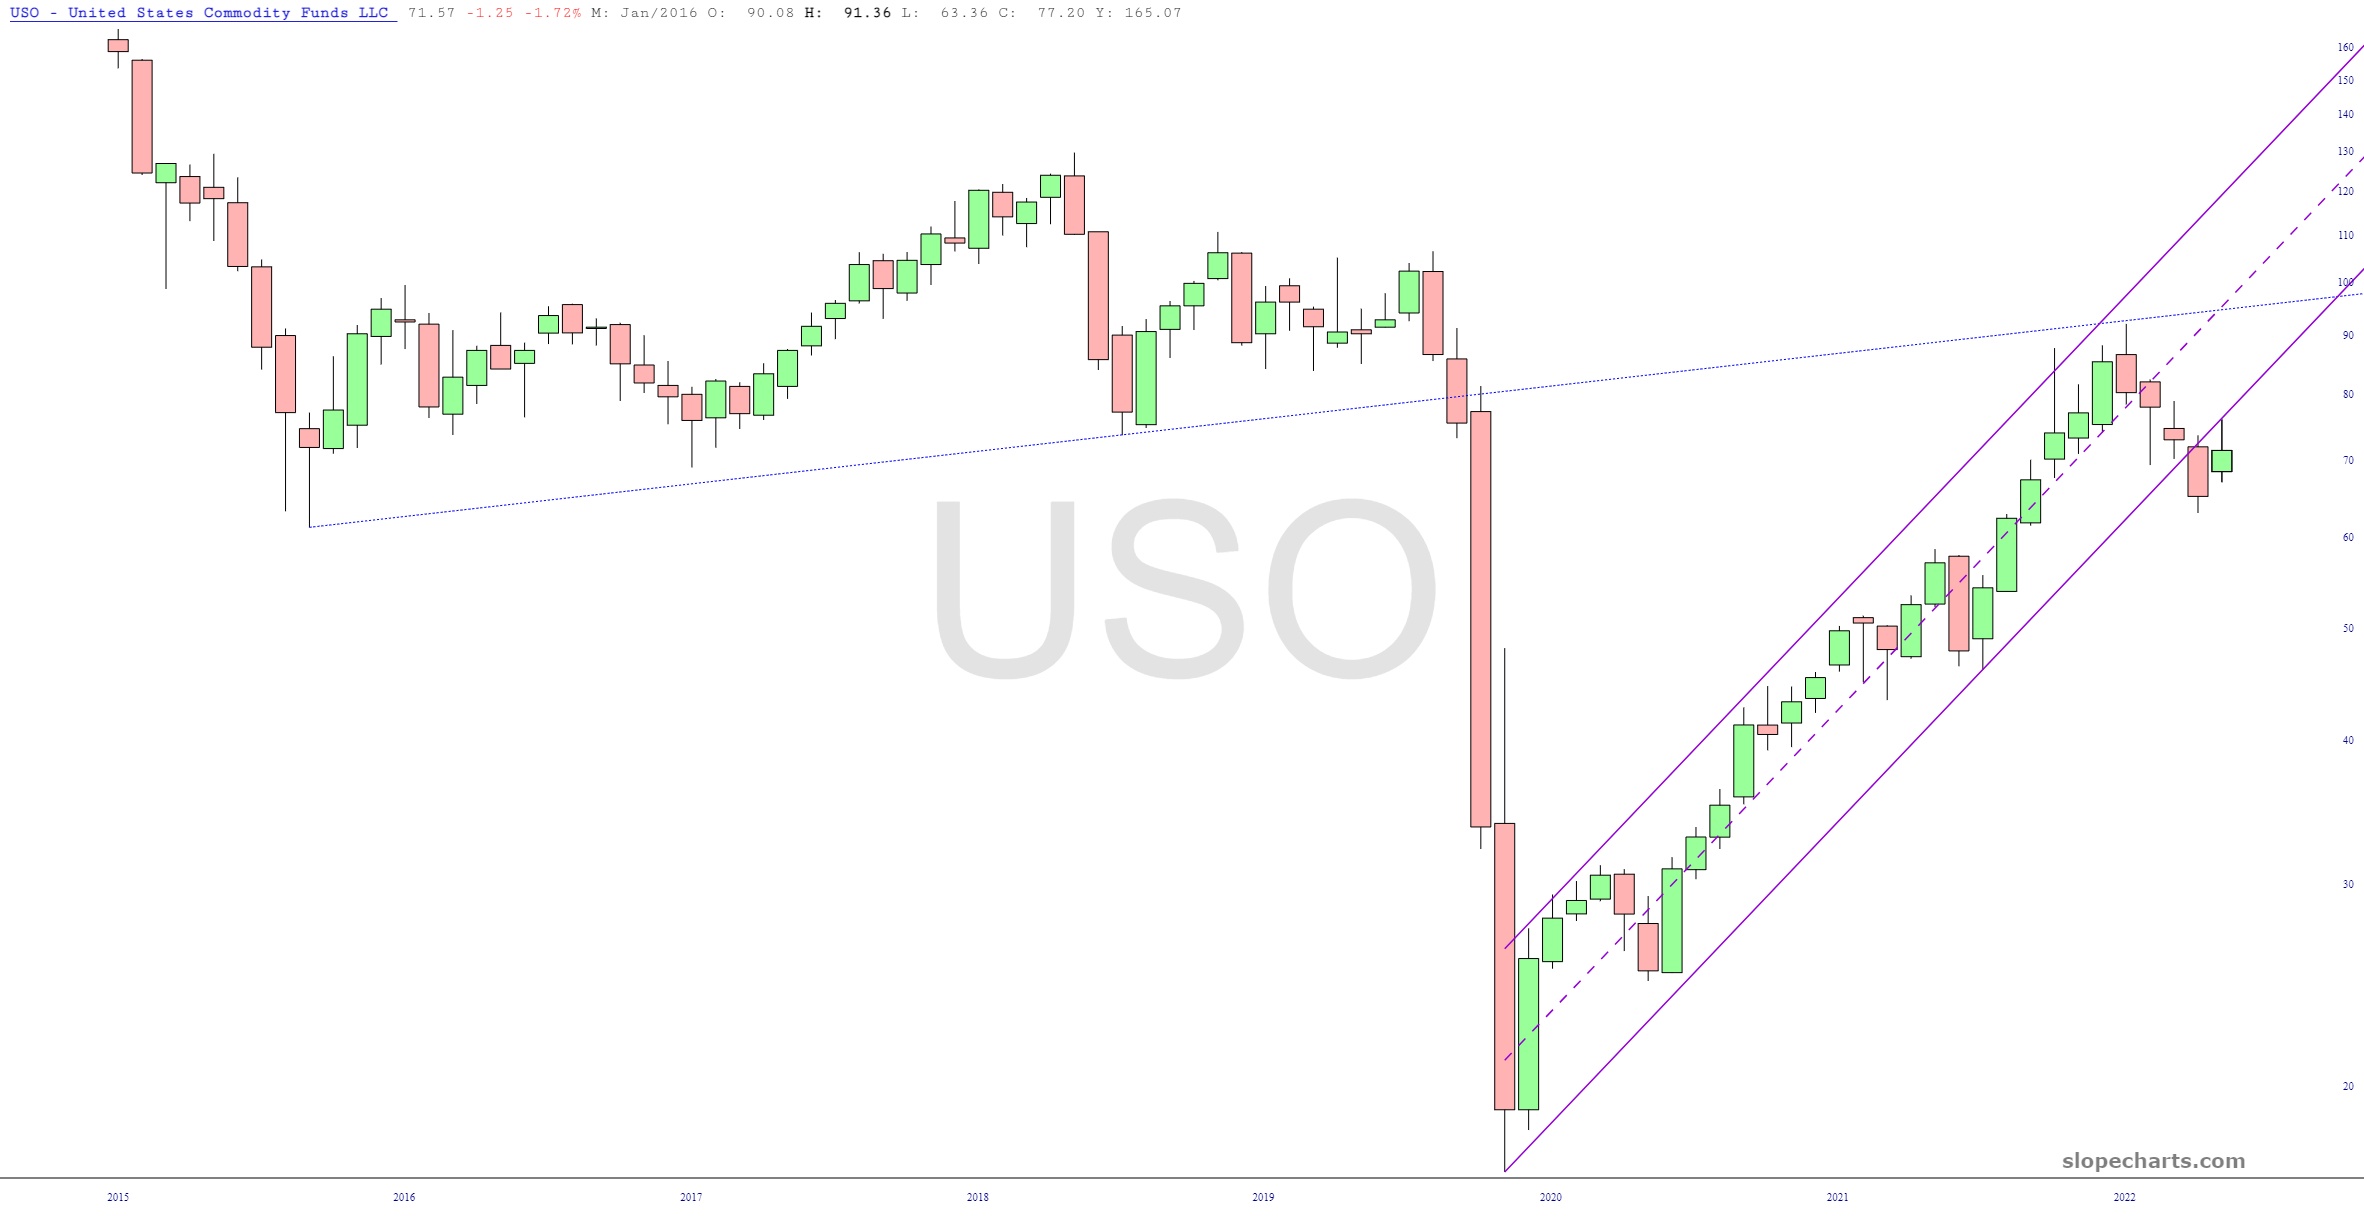
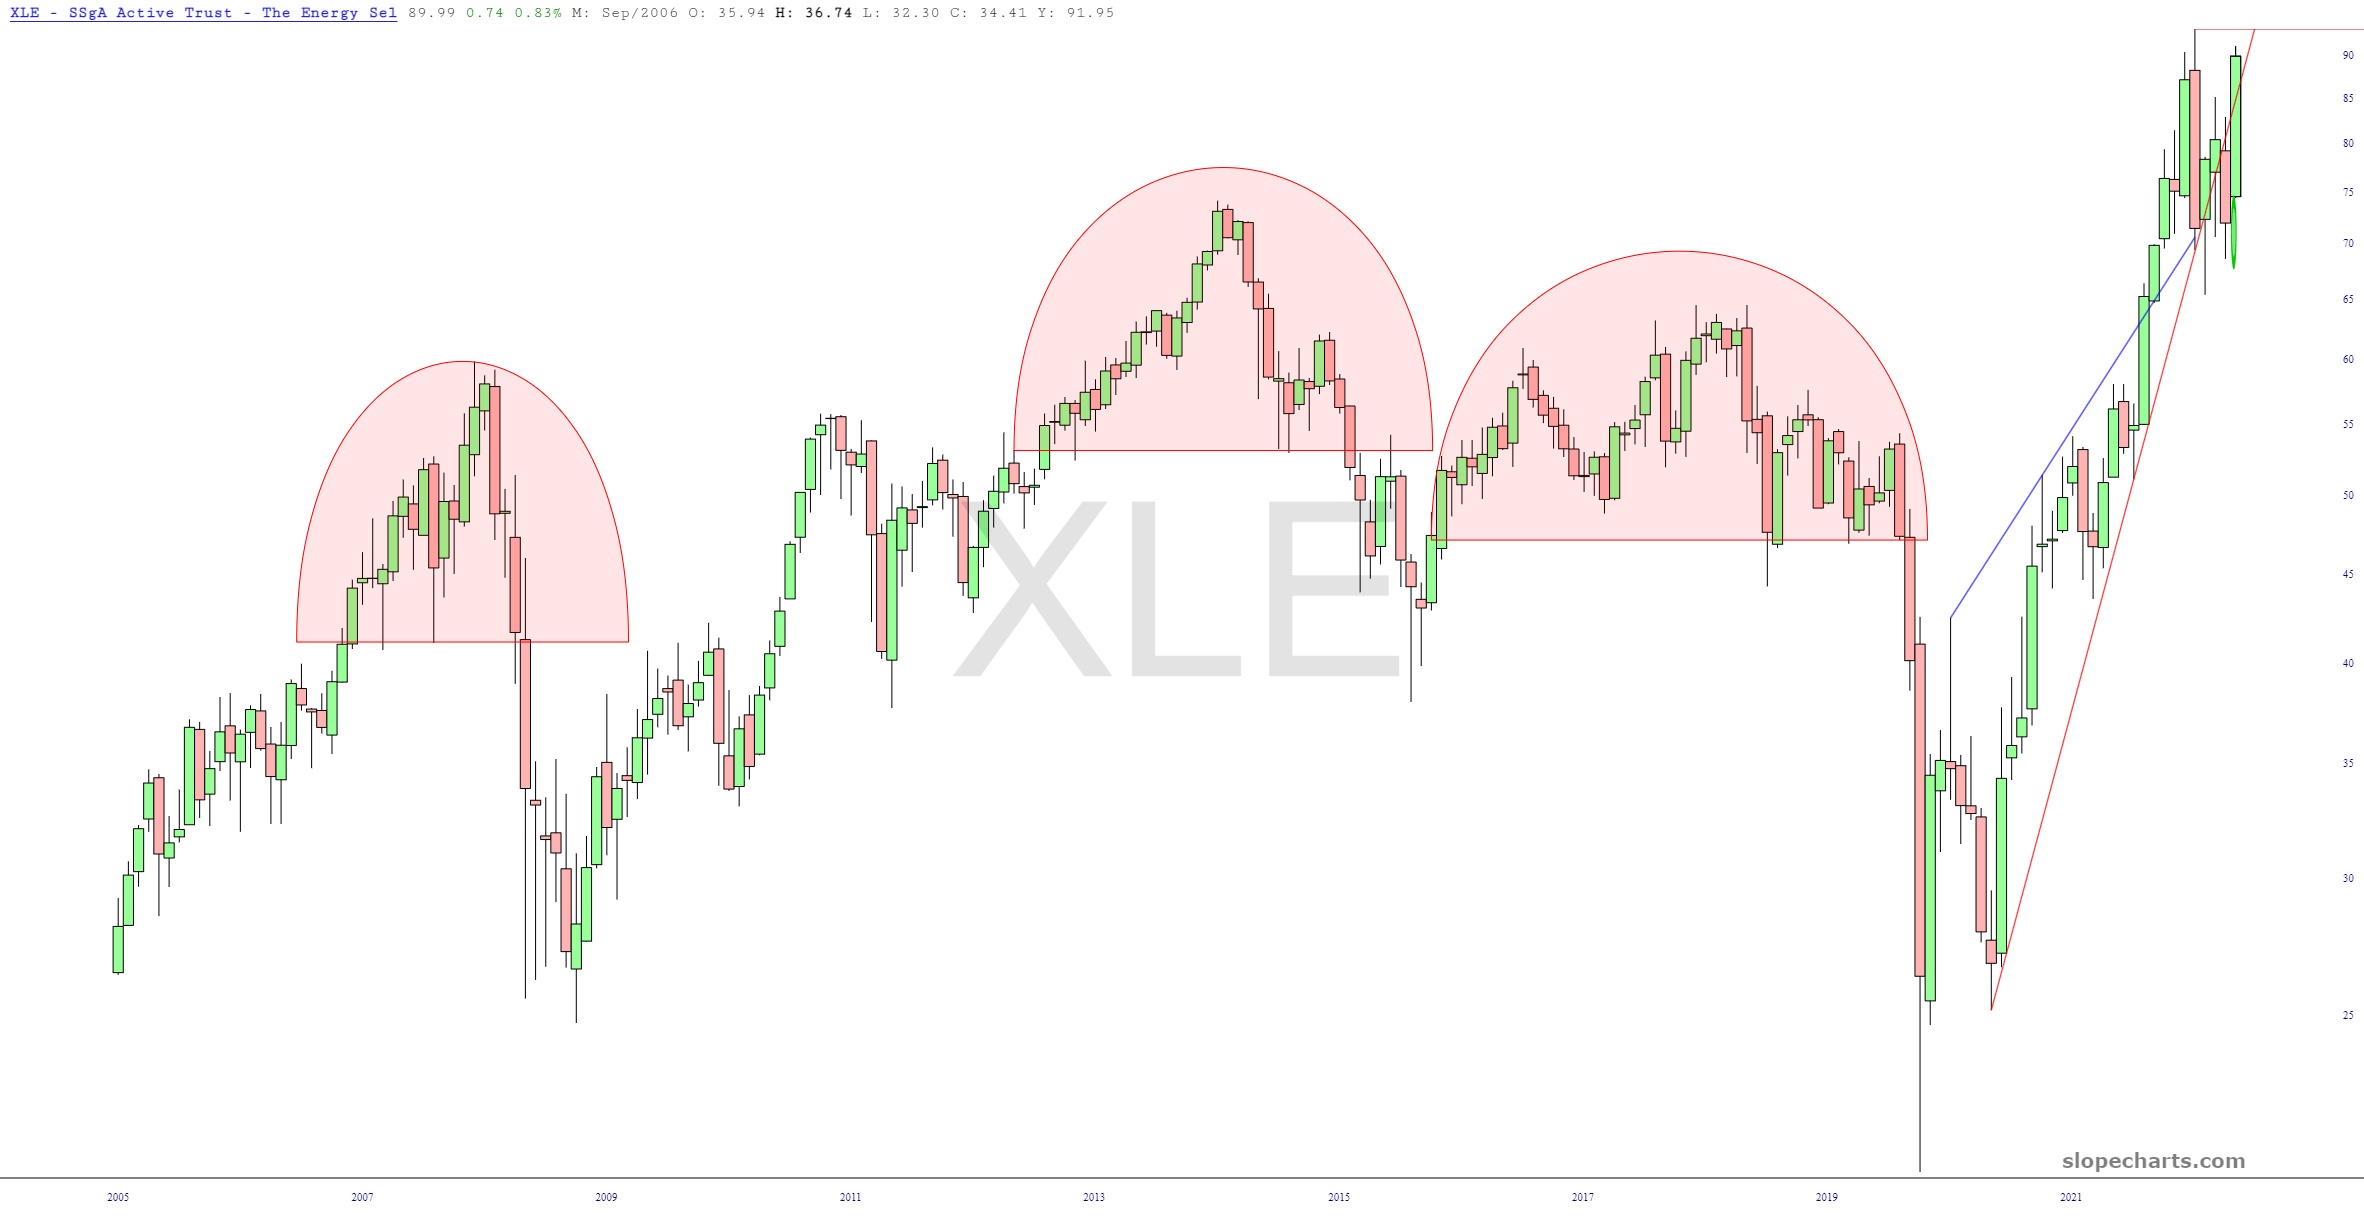
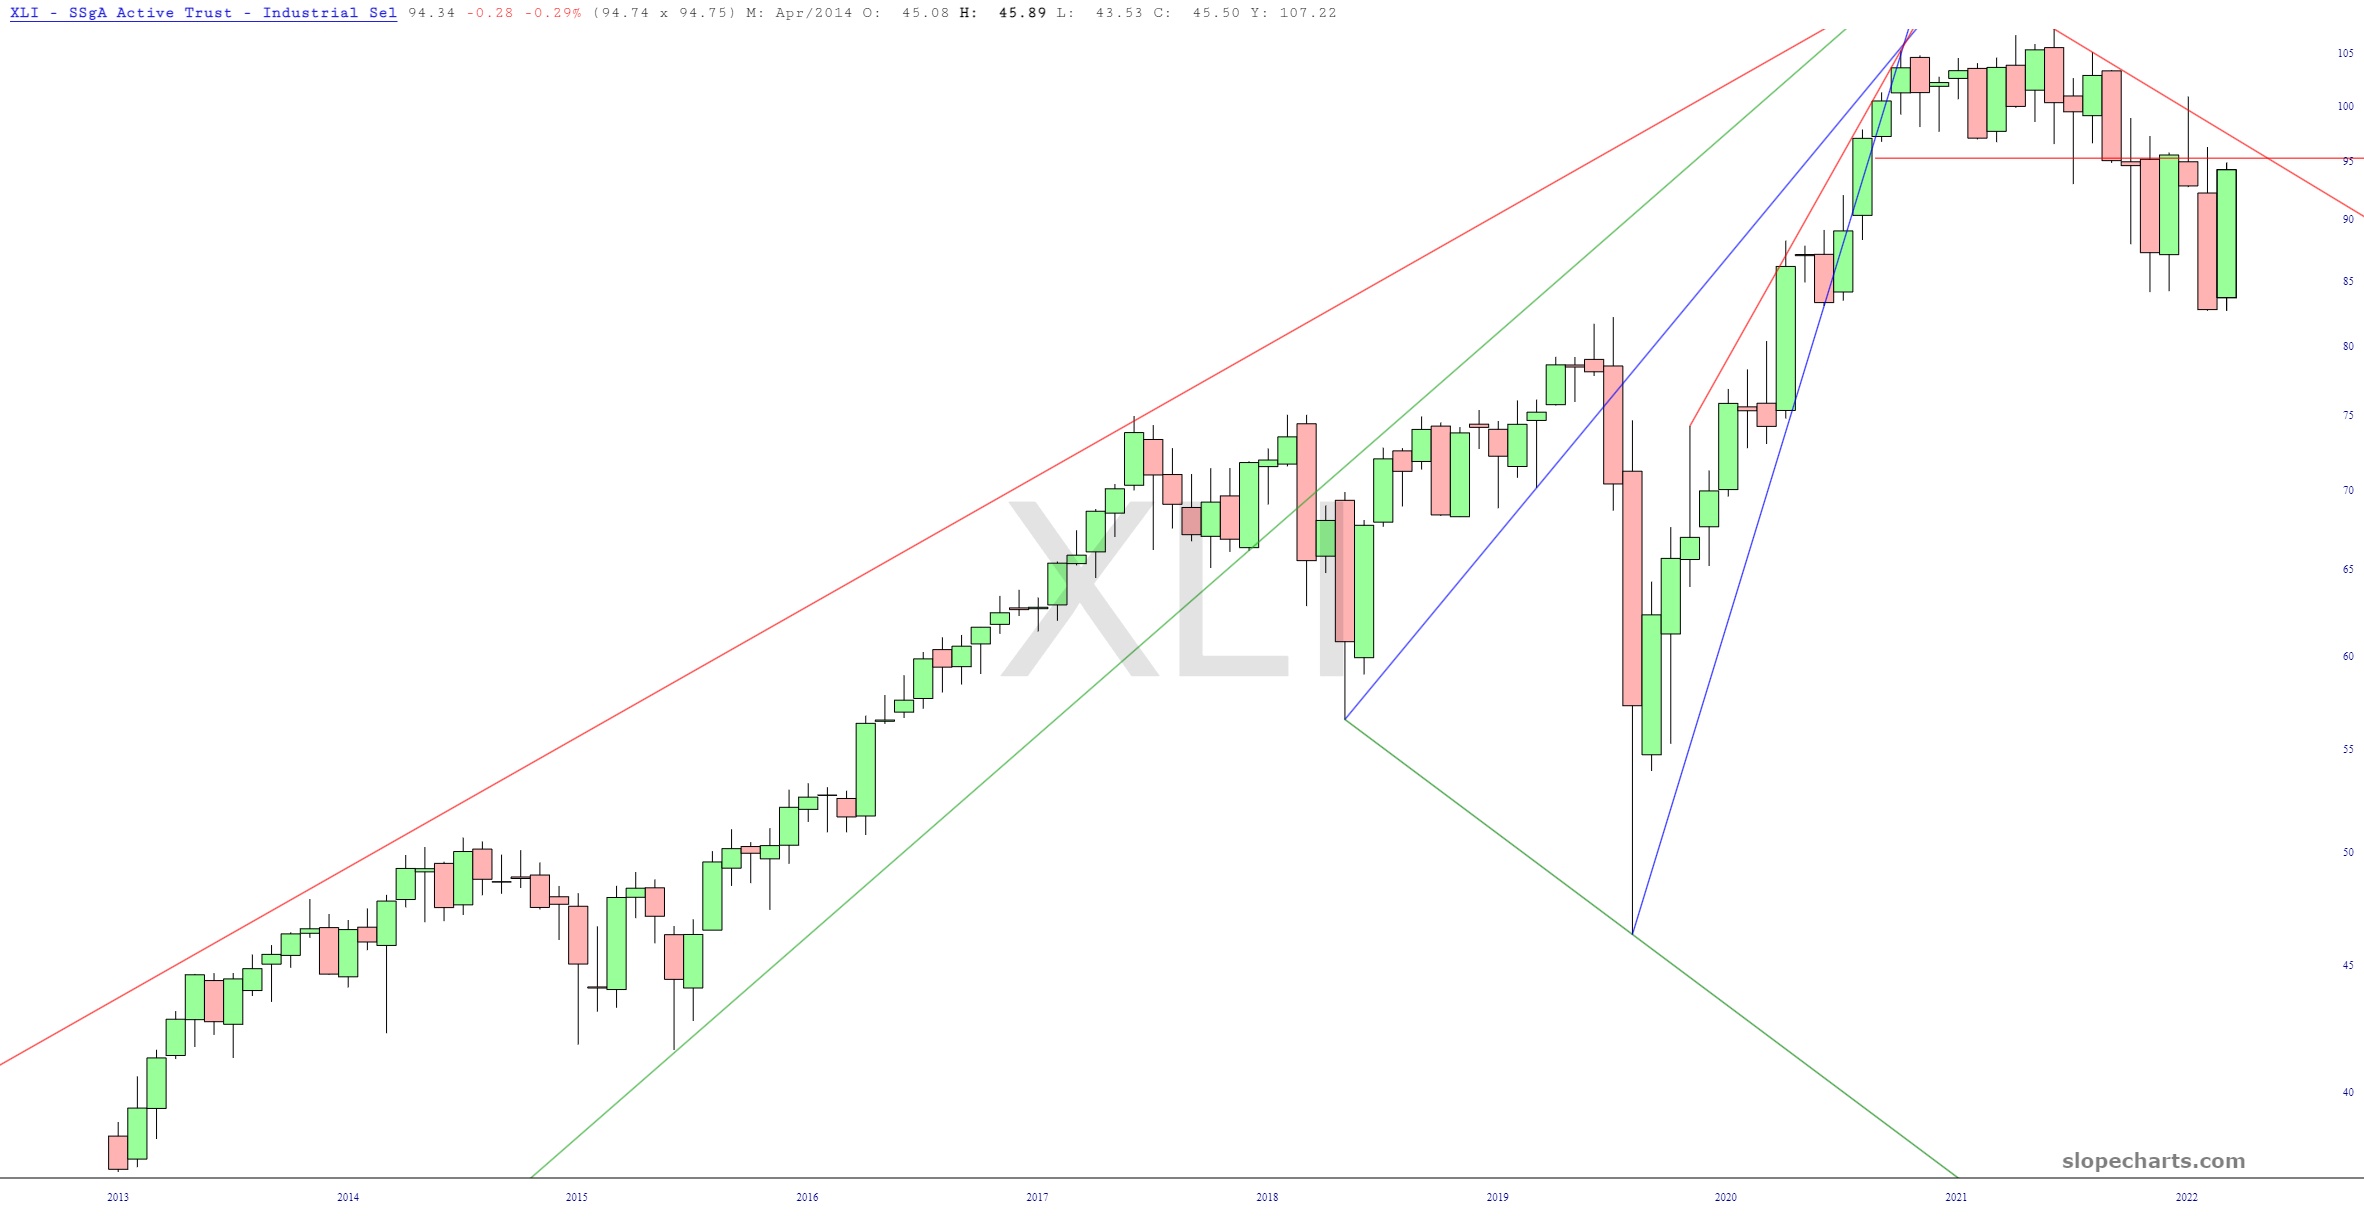
Below are a variety of monthly bar charts of important ETFs, with some thoughts in the caption area of each.
I am providing this chart from the 2010s to show what you are NOT going to see below, which is a ceaselessly ascending market with hardly a downtick in sight. Thank God those days are behind us.This is a channel just itching to be broken. It hasn’t happened yet, though. It’s all up to crude oil.Oh, how I wish the U.S. stock market looked like China’s! Just look at this fiasco! Their bear market is taking on the magnitude, persistence, and violence of the great financial crisis. I am green with envy.My act of totally missing the boat on this one may be shaping up as a second chance.If gold breaks this long-term trendline, I think this rotten investment is going to get rotten-er.The S&P 500 shows there’s plenty of room left between present price levels and key support.The tech stocks nailed their support line perfectly. The next goal, of course, is to break that sucker, which would open the window for a more more severe bear bloodbath.Interest rates, viewed by way of the ultra-short bond fund TBT, have skyrocketed.This year has been the world one for bonds in human history. The wipeout in values is jaw-dropping.I believe crude oil is in its early stages of an extraordinary breakdown.However, energy stocks have been absolute monsters. This year’s activity has utterly defied gravity, and you can see how, unlike decades past, no normal top has come anywhere close to forming.This one is a real favorite of mine, since this months’ strength has mashed prices up against a very well-formed long-term top.