
A lot of indecision on the markets this week but on the bigger picture SPX remains under major resistance at the monthly middle band and the main support/resistance trendline. There is no obvious reason I can see to think that may break up now, but if bears fail to hold the short term resistance here we might well see a retest of the May high next.
SPX monthly chart:
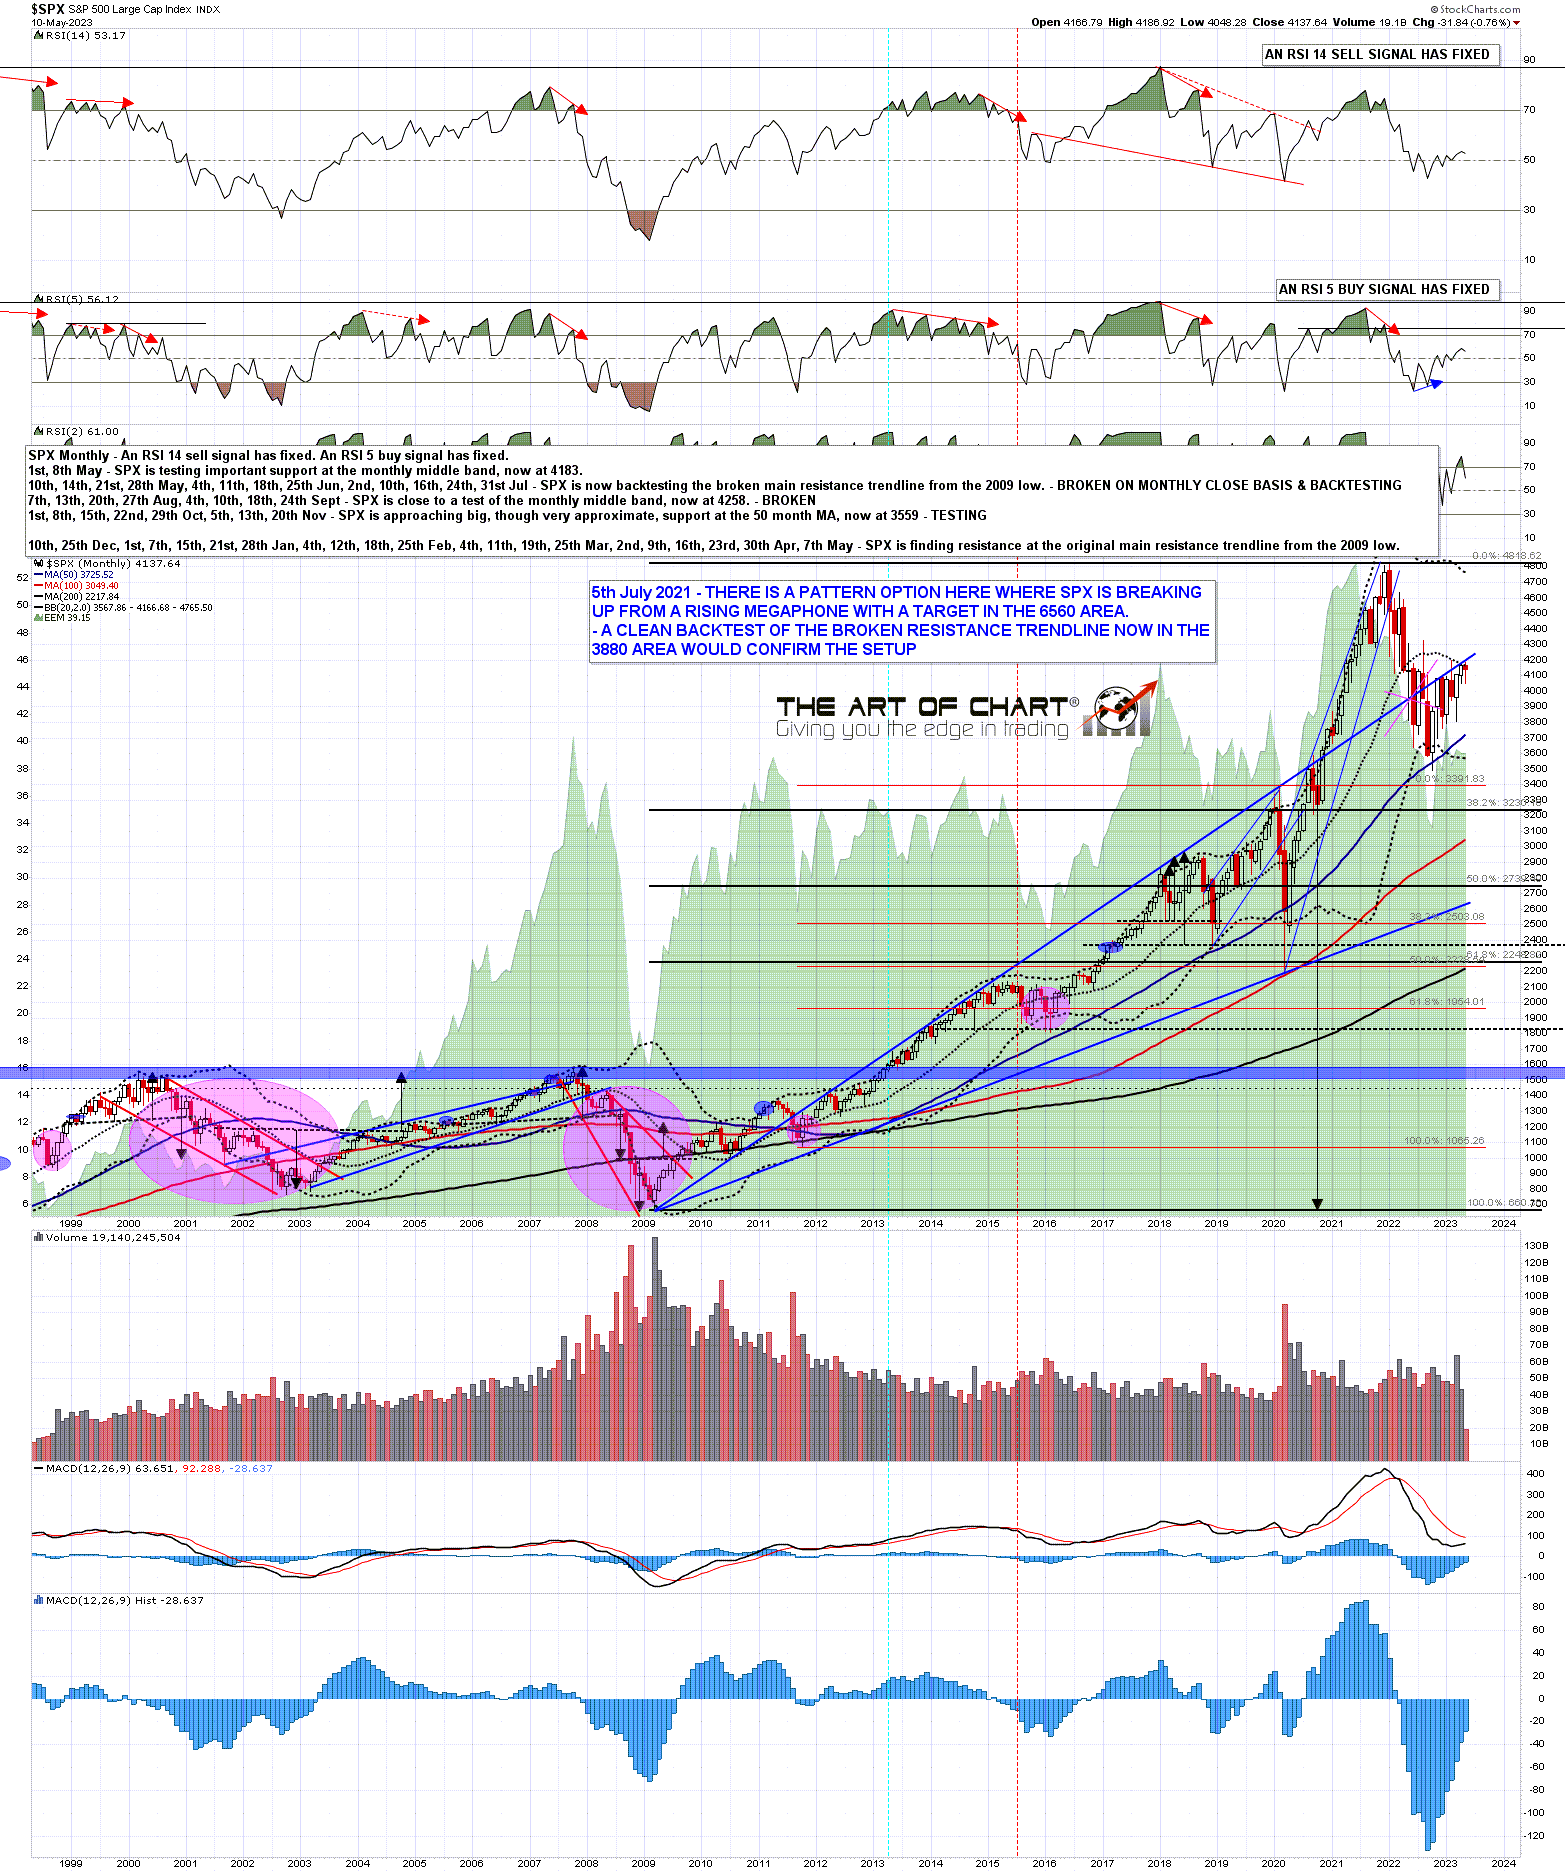
So how is that short term resistance holding up? The main two levels I’m watching here are the monthly pivot at 4130, with yesterday’s close at 4137. Not holding as resistance currently, but not converted to support yet either.
SPX daily chart:
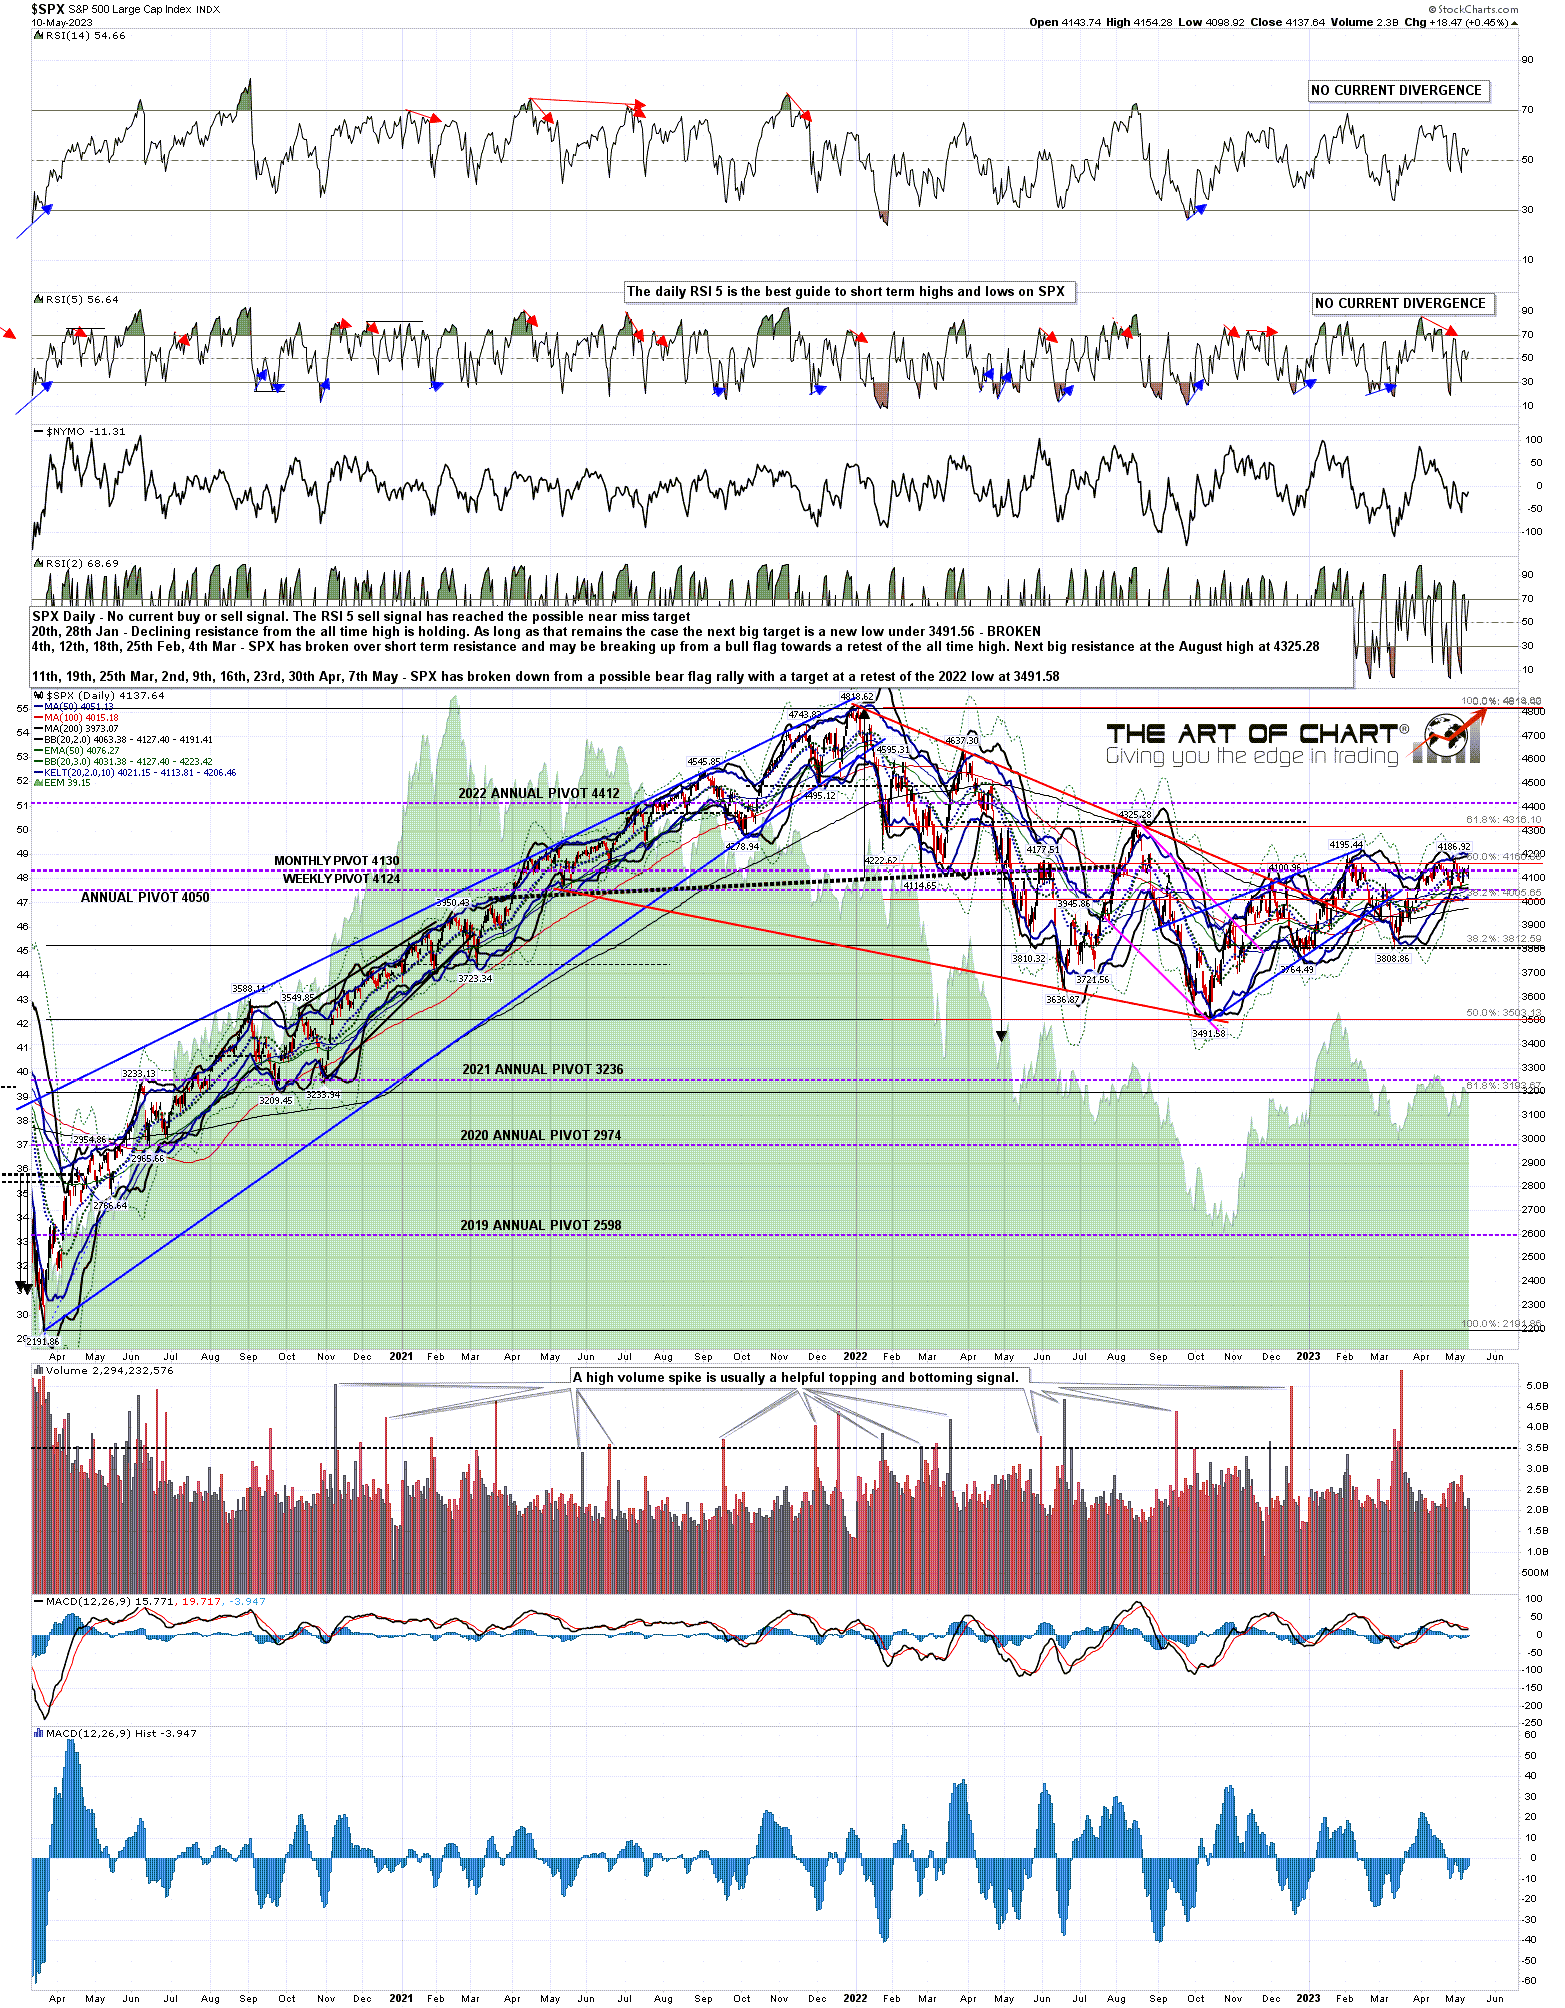
The daily middle band, closing last night at 4127 is also in the balance here, with a break back above on Friday that was confirmed on Monday, with a modest break down again on Tuesday that failed yesterday. On balance the bulls are holding it as support so far, but still need to convert it convincingly to support.
SPX daily BBs chart:
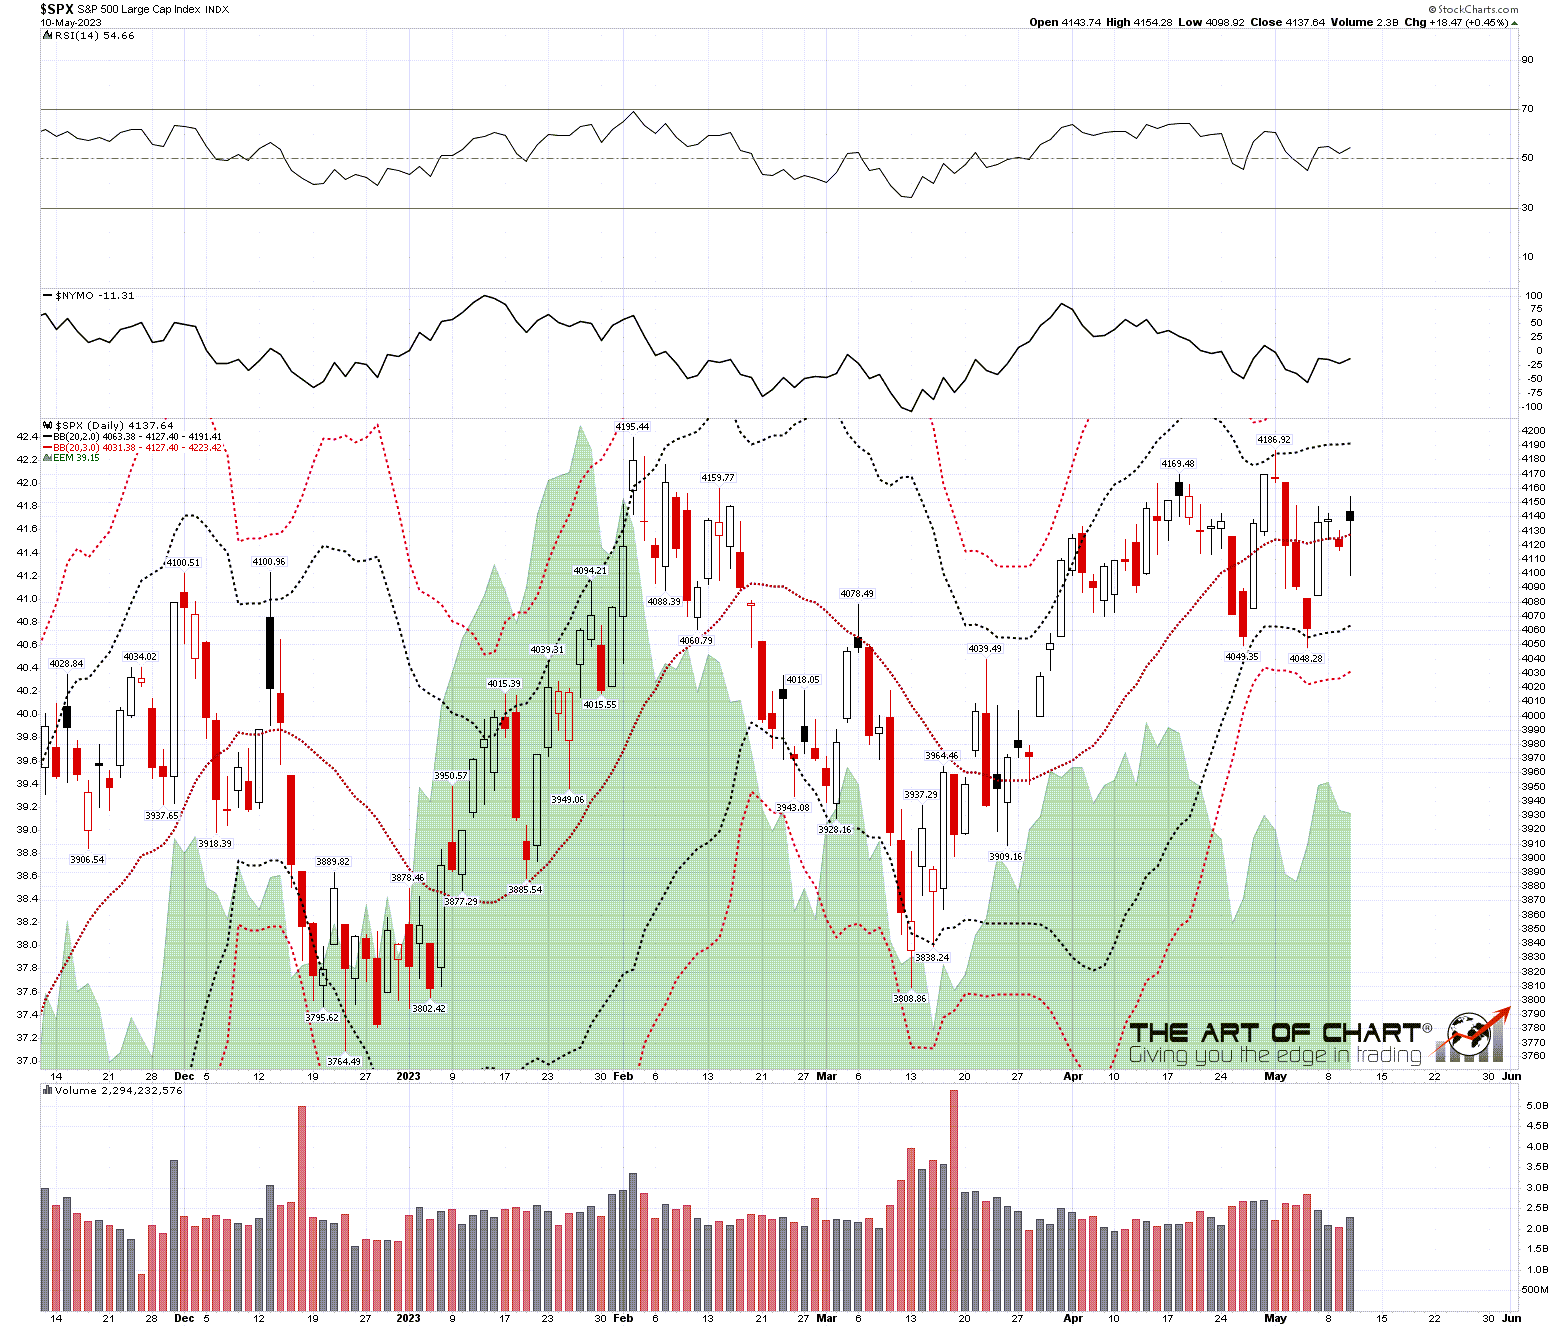
On the SPX chart the double top is still intact, though the rally definitely went further than expected.
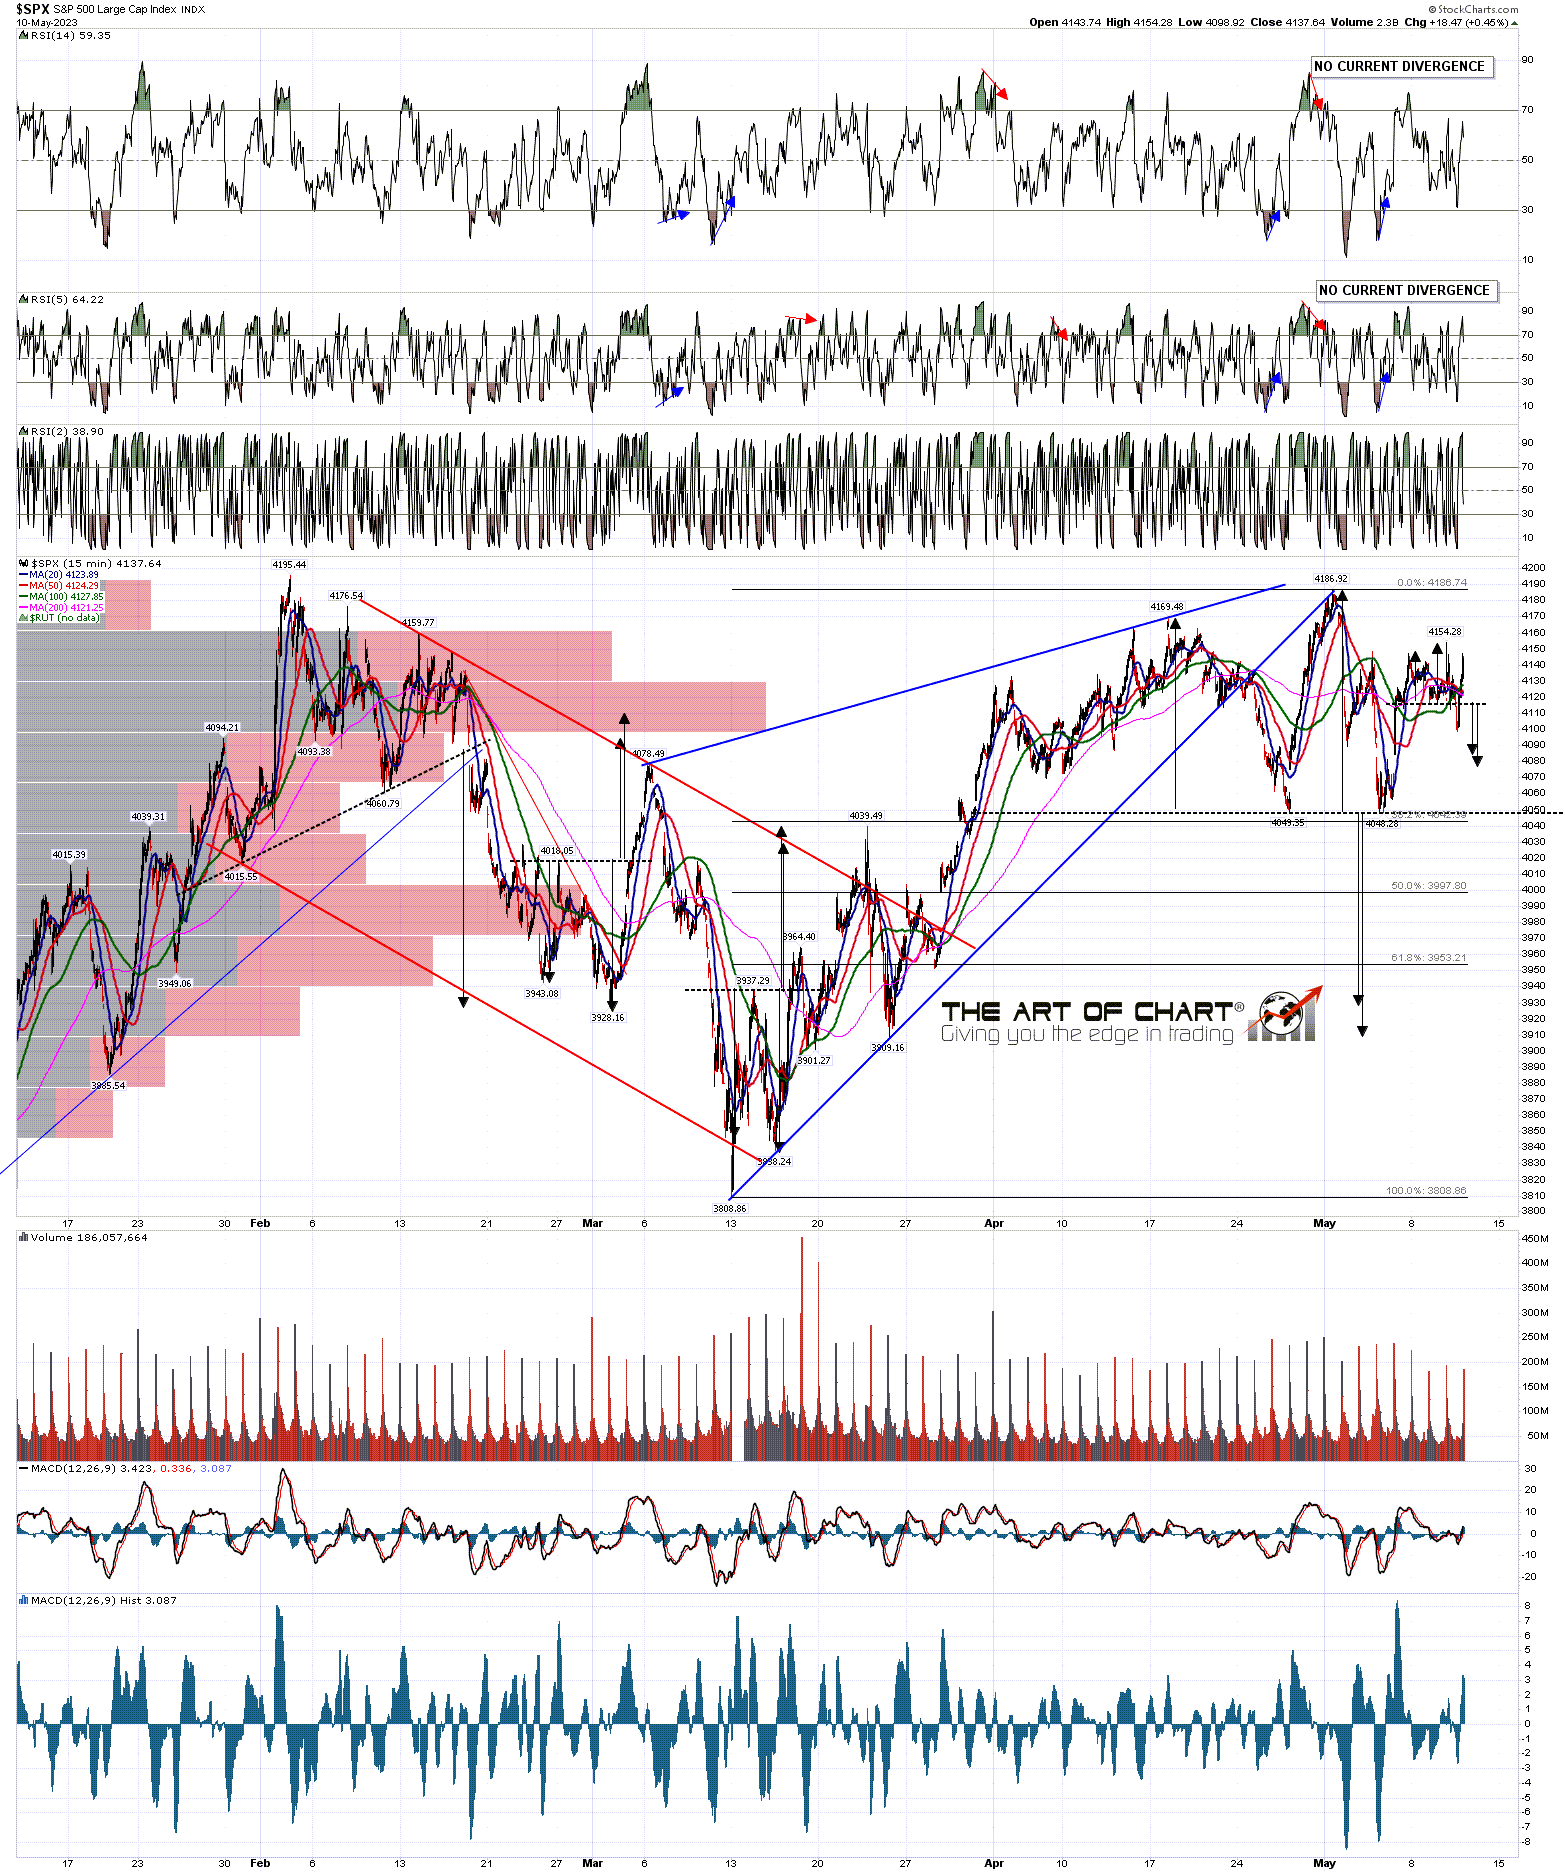
SPX 15min chart:
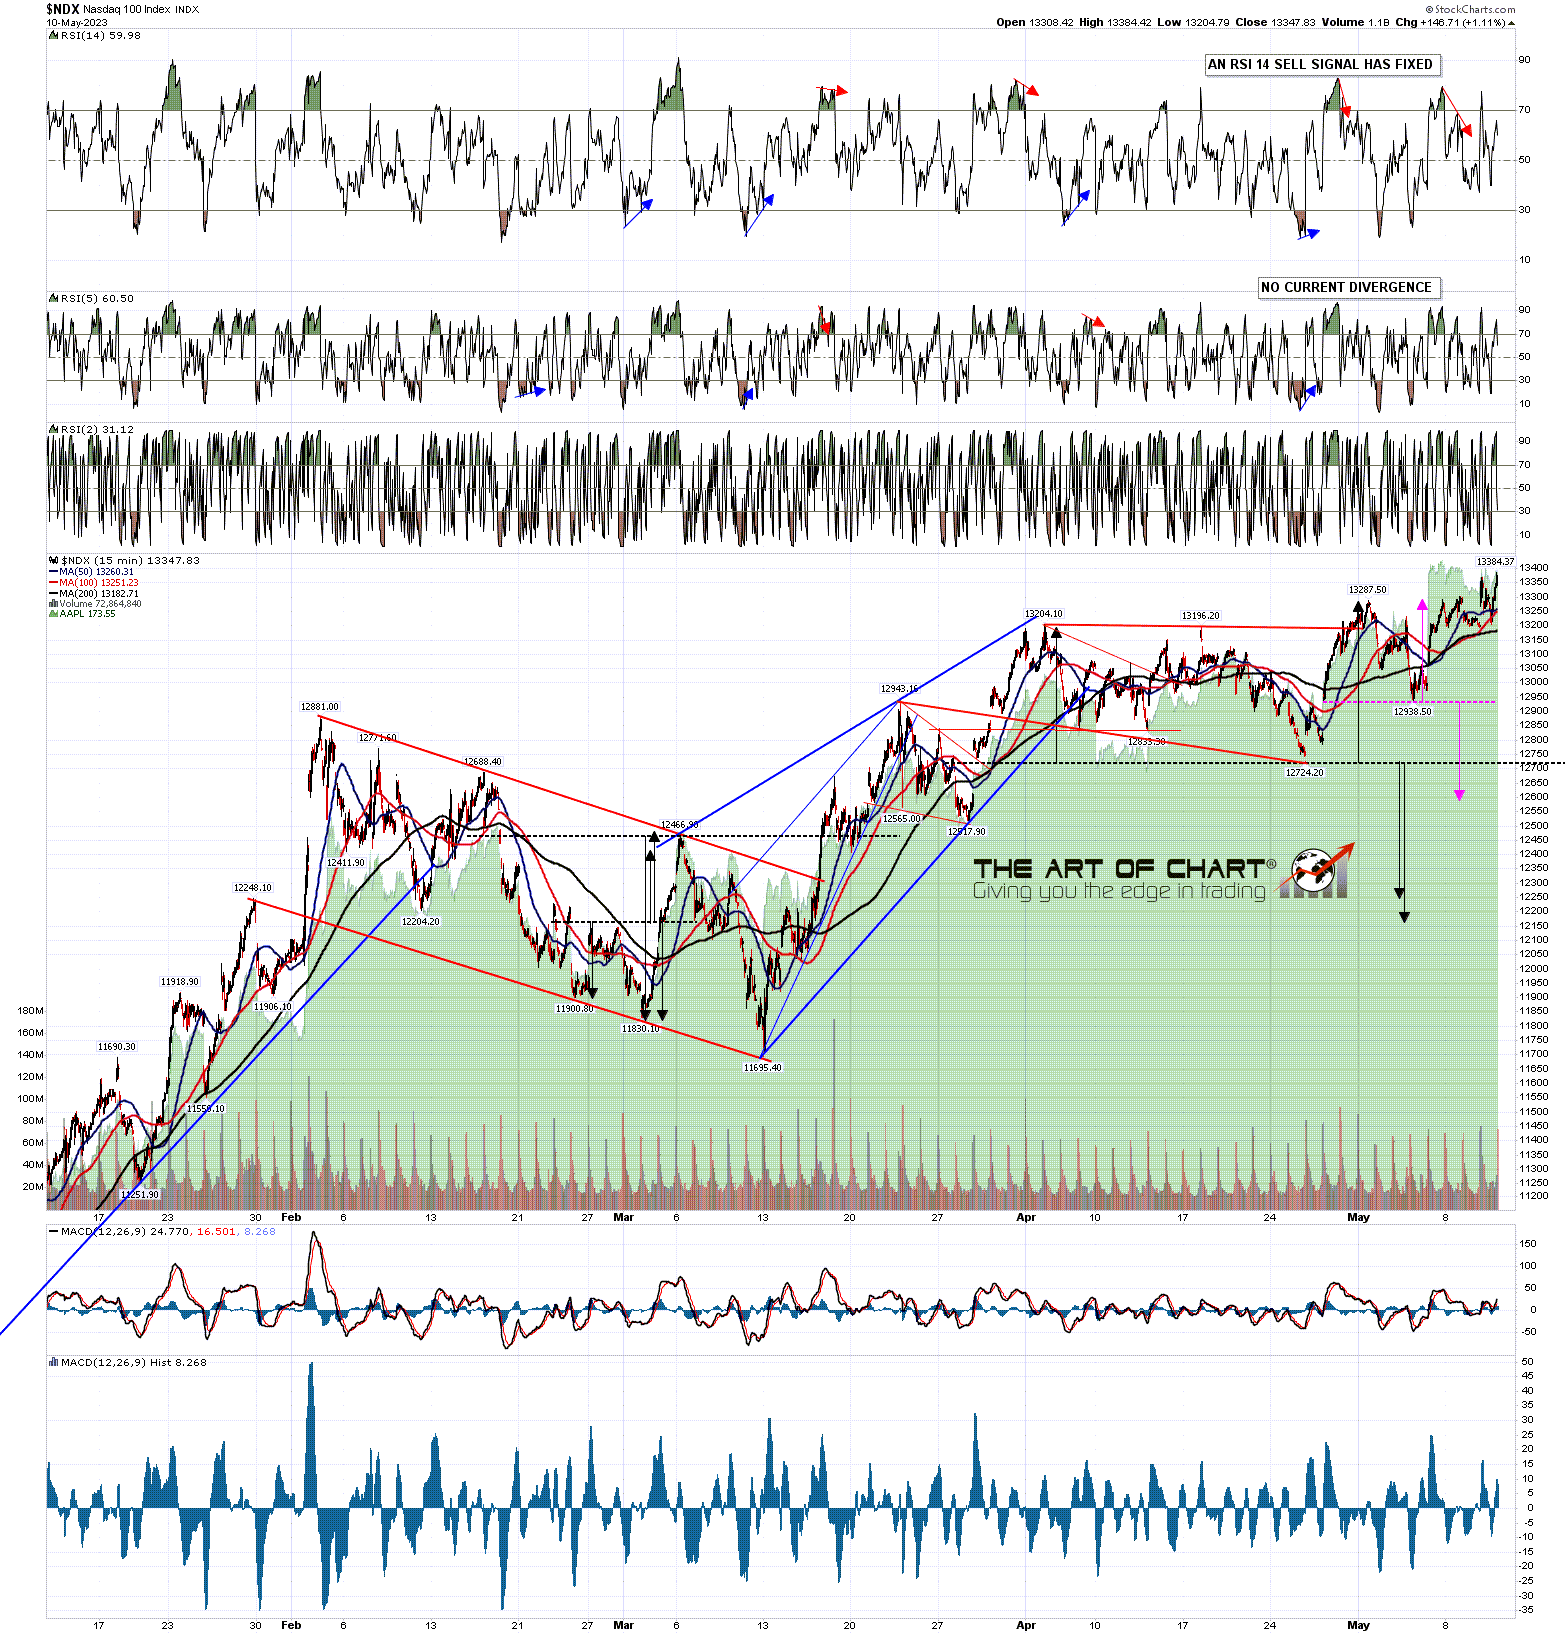
On the NDX chart the setup looks just as good, with a high quality nested double top setup formed if NDX should fail here.
NDX 15min chart:
If equities are going to break back down then the obvious day to do that would be today, which historically leans 67% bearish, and on SPX a sustained break back below yesterday’s low at 4098.92 would look for a retest of last week’s lows at 4048/9. I’m a bit doubtful about seeing that tomorrow if we don’t see it today.
On the bigger picture I still think that the odds are 75%+ that SPX has topped out or is topping out short term for at least a decent retracement, and we still have topping patterns breaking down. Is there a chance that SPX will break up over resistance here instead of failing? Always, every good setup can always fail and go the other way, and I have assigned a probability of 25% to that, though in practical terms I think the odds of that would be more like 15% to 20%, rising back to 25% if we see a retest of the May high.
I set up a modestly sized model trade for the next few months and am following it here. I entered that with 9x MES (micro-ES) just before the close on Friday 28th April at 4190. 10x MES is equivalent to 1x ES, so this isn’t a large trade, but I’m planning to trade around it on the way down.
The entry was at 4190, the target is at 3430, 760 handles below. The stop for the trade was 70 handles above at 4260 (at which point SPX would likely be breaking up), so the risk/reward ratio is slightly over 1:10, though if the trade needs to be rolled that will likely reduce a bit below that. As the initial double top has now broken down I have moved the stop to even at 4190. If that is stopped out I would likely re-enter at a retest of the May high. Max risk on the trade was $3,150, and if taken off at target without the need to roll the trade will yield $34,200. I will consider taking a third off near the 3940 and 3690 areas if seen, and perhaps adding them back on after any subsequent rallies. We’ll see how that goes, but at the time of writing this trade is currently up about 60 handles.
At 5pm EST after the close today we are doing our monthly free public Big Five and Key Sectors webinar at theartofchart.net looking at big tech and the key sector ETFs. If you’d like to see that you can register for that here, or on our May Free Webinars page.
If you are enjoying my analysis and would like to see it every day at theartofchart.net, which I co-founded in 2015, you can register for a 30 day free trial here. It is included in the Daily Video Service, which in turn is included in the Triple Play Service.
