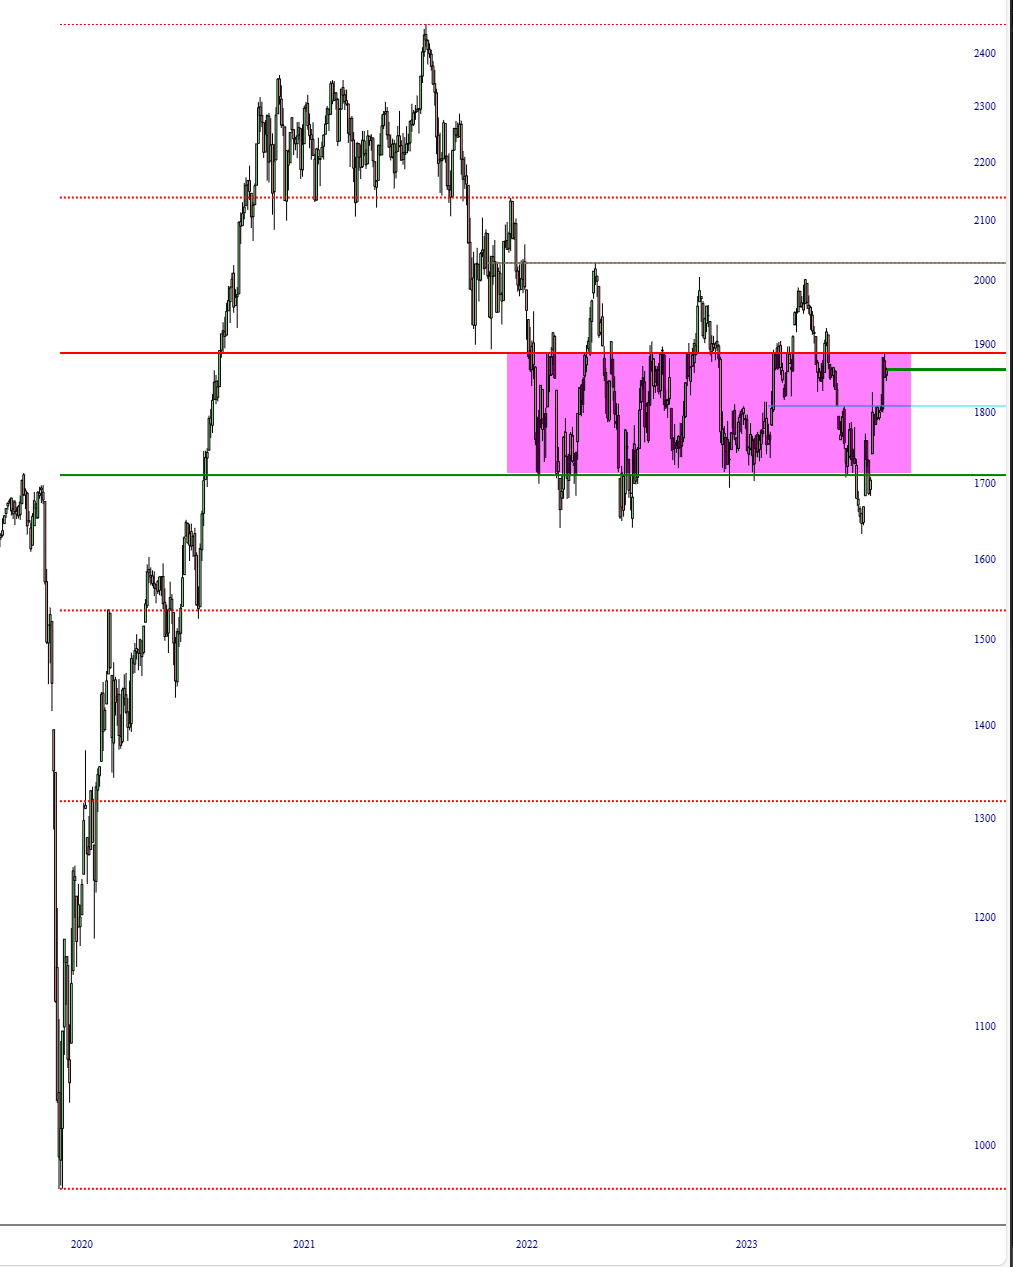
Below is a chart of the Russell 2000 cash index. I’ve tinted the area which has represented the vast majority of trading over a full two years. You will note that the Fibonacci Retracements are anchored to the lifetime high, at the top, and the Covid crash low, at the bottom.