Preface to all posts: Instead of my typical ETF videos over the weekend, I went through all the charts and put them into certain groupings. In this post, I cover the ETFs that seemed appropriate for the grouping mentioned in this post's title.
Of the five posts I did this weekend about these ETF groupings, this is my favorite.
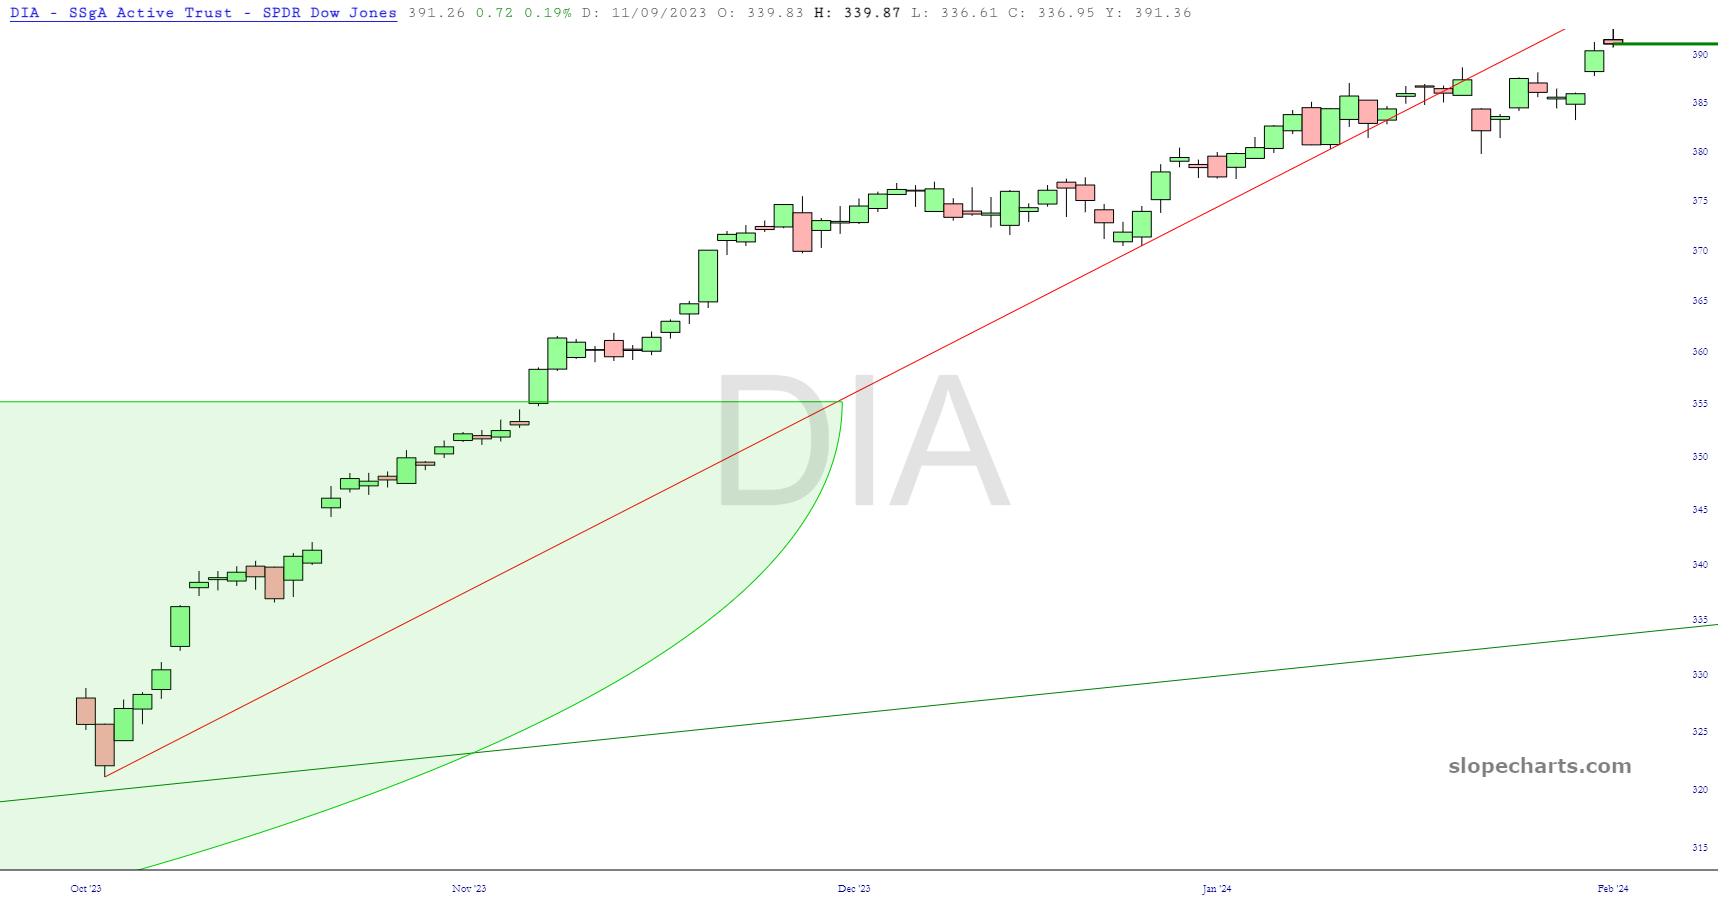
Starting with the Dow Industrial “diamonds” ETF, we see here how the trendline that used to define support is now resistance, and Friday’s high got quite close to tagging the underbelly of this line.
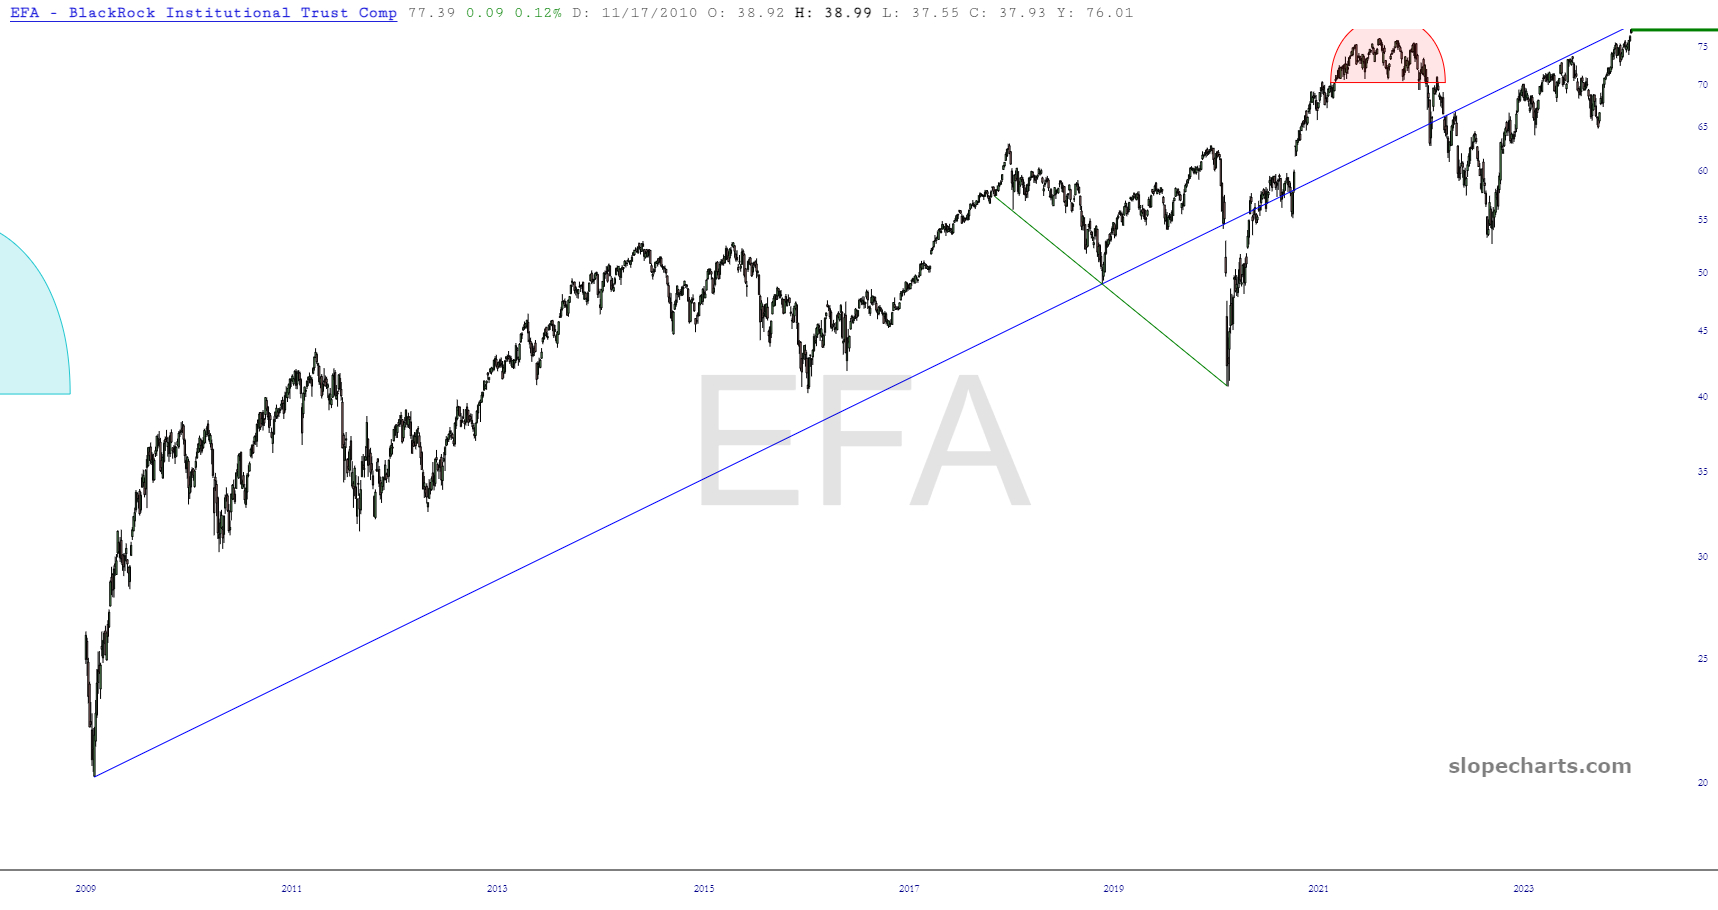
The global markets represented by EFA has a trendline going back not just months, but decades, and the price presently is in a hazardous position relative to the broken trendline.
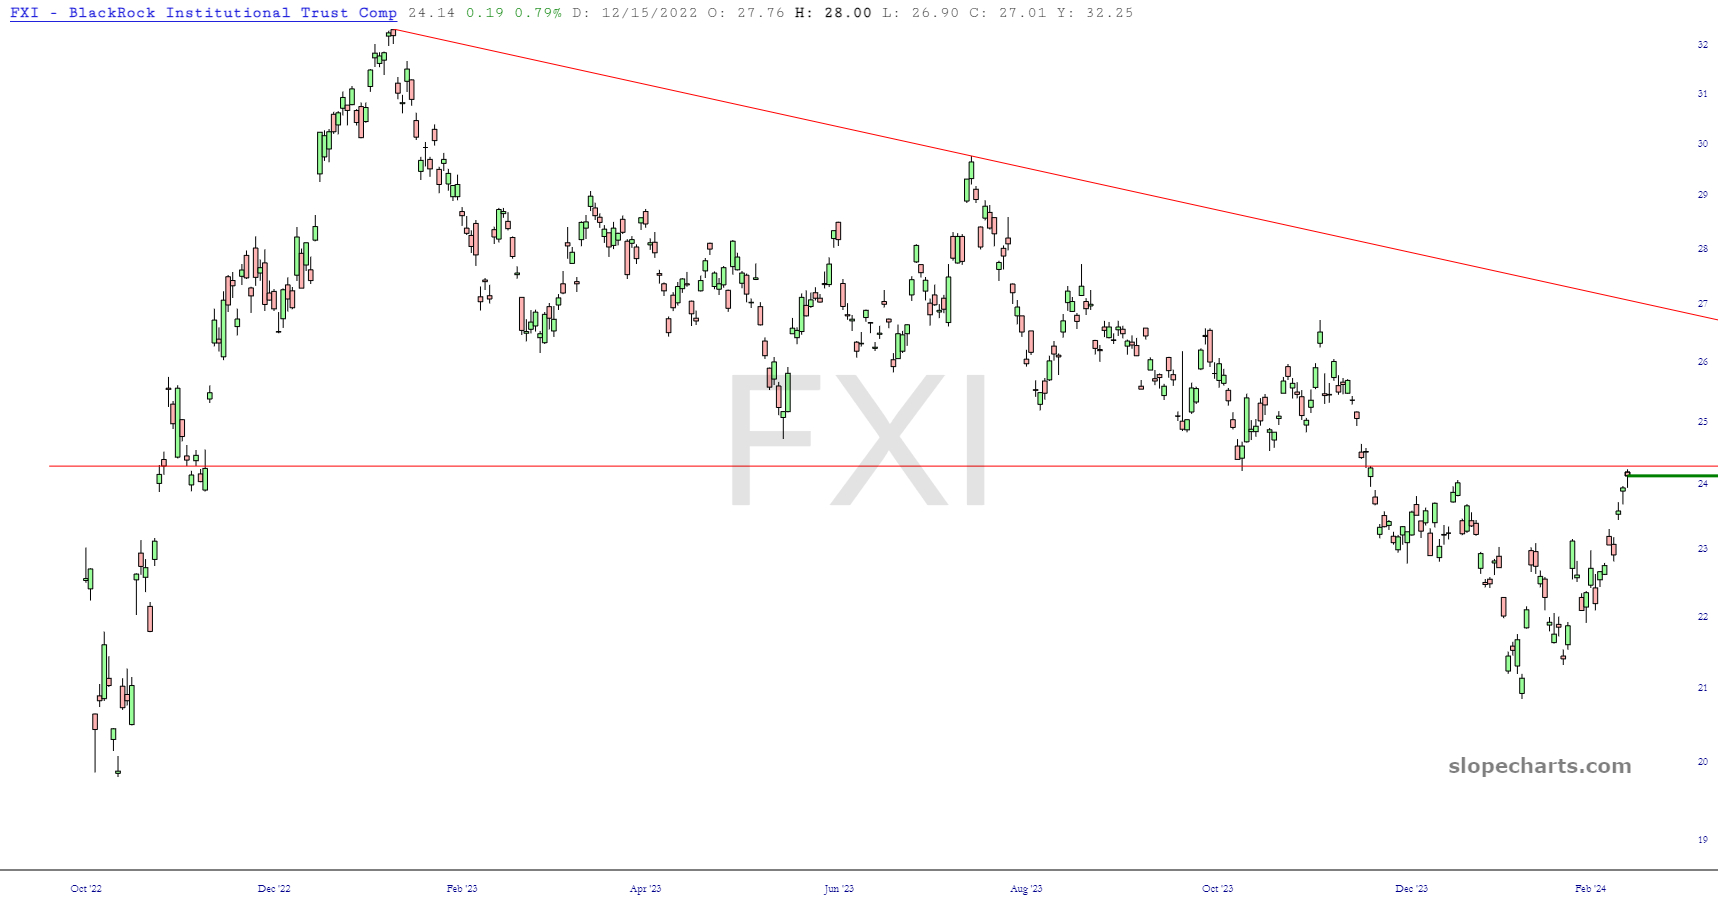
The Chinese government has been stimulating the holy hell out of their own markets, literally hurling trillions of yuan at the problem, banning short-selling, and making it illegal for firms to do ANY selling of securities at the start and end of the day. Based partly on this chart, and partly on principle, I have acquired a large chunk of May puts against FXI.
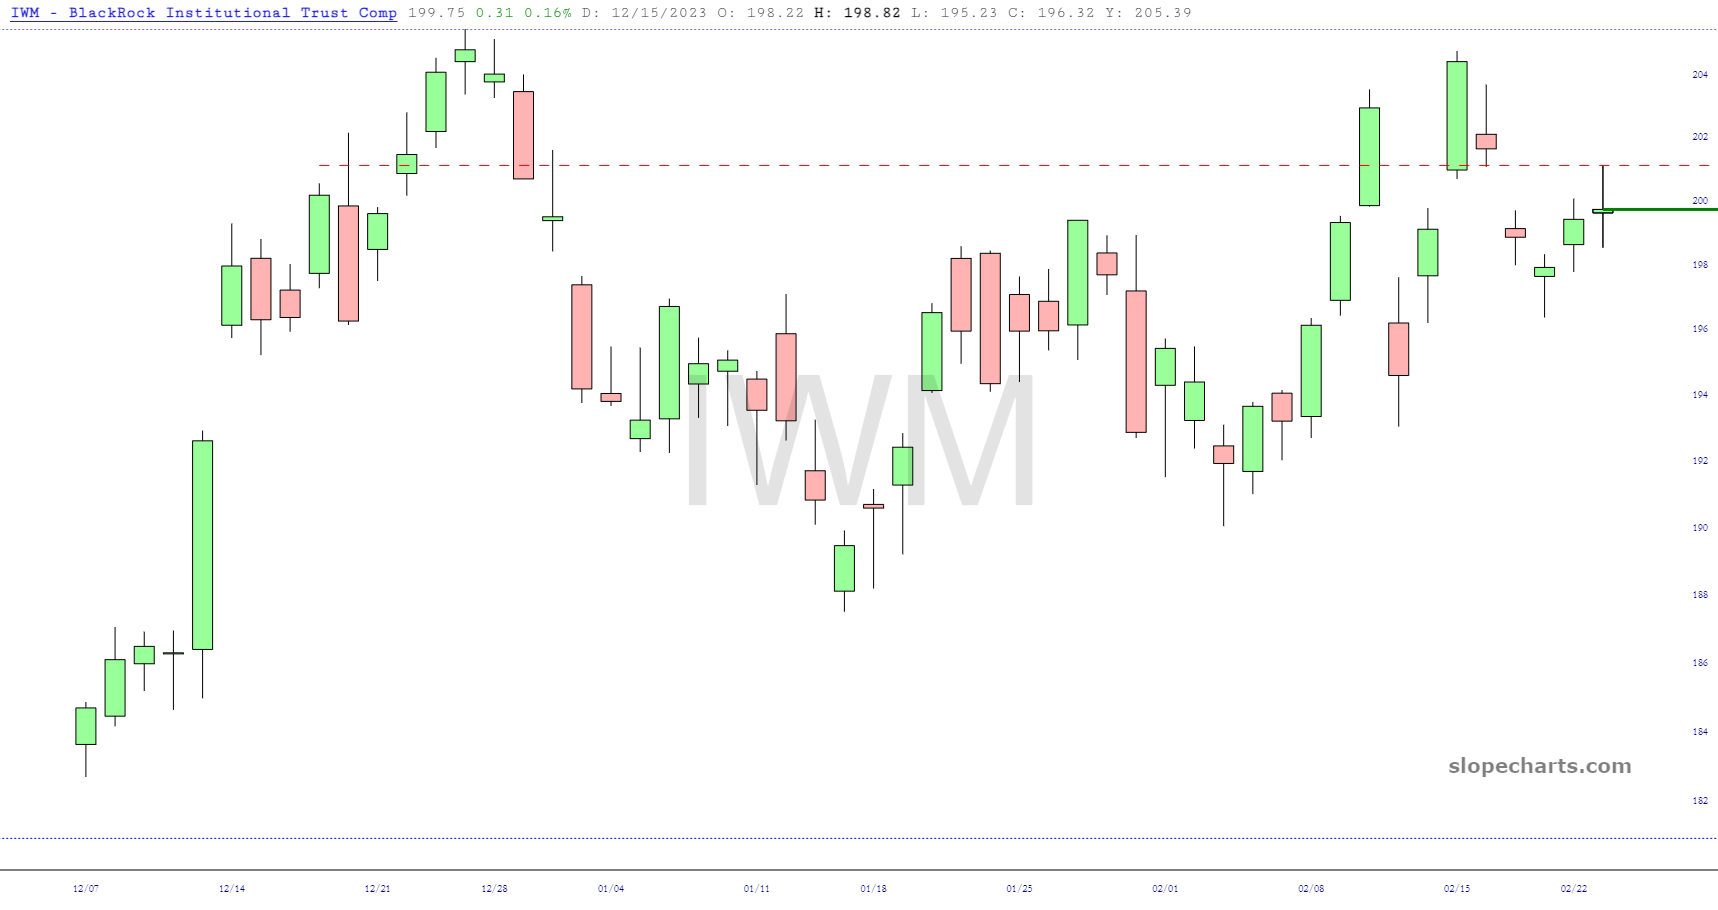
This is a close-up view of IWM, highlighting the fact that we have sealed the price gap. Monday will be a big decision point, to see if we retreat from this line or go ahead and slice through it, which would offer up the potential of a breakout from the entire pattern.
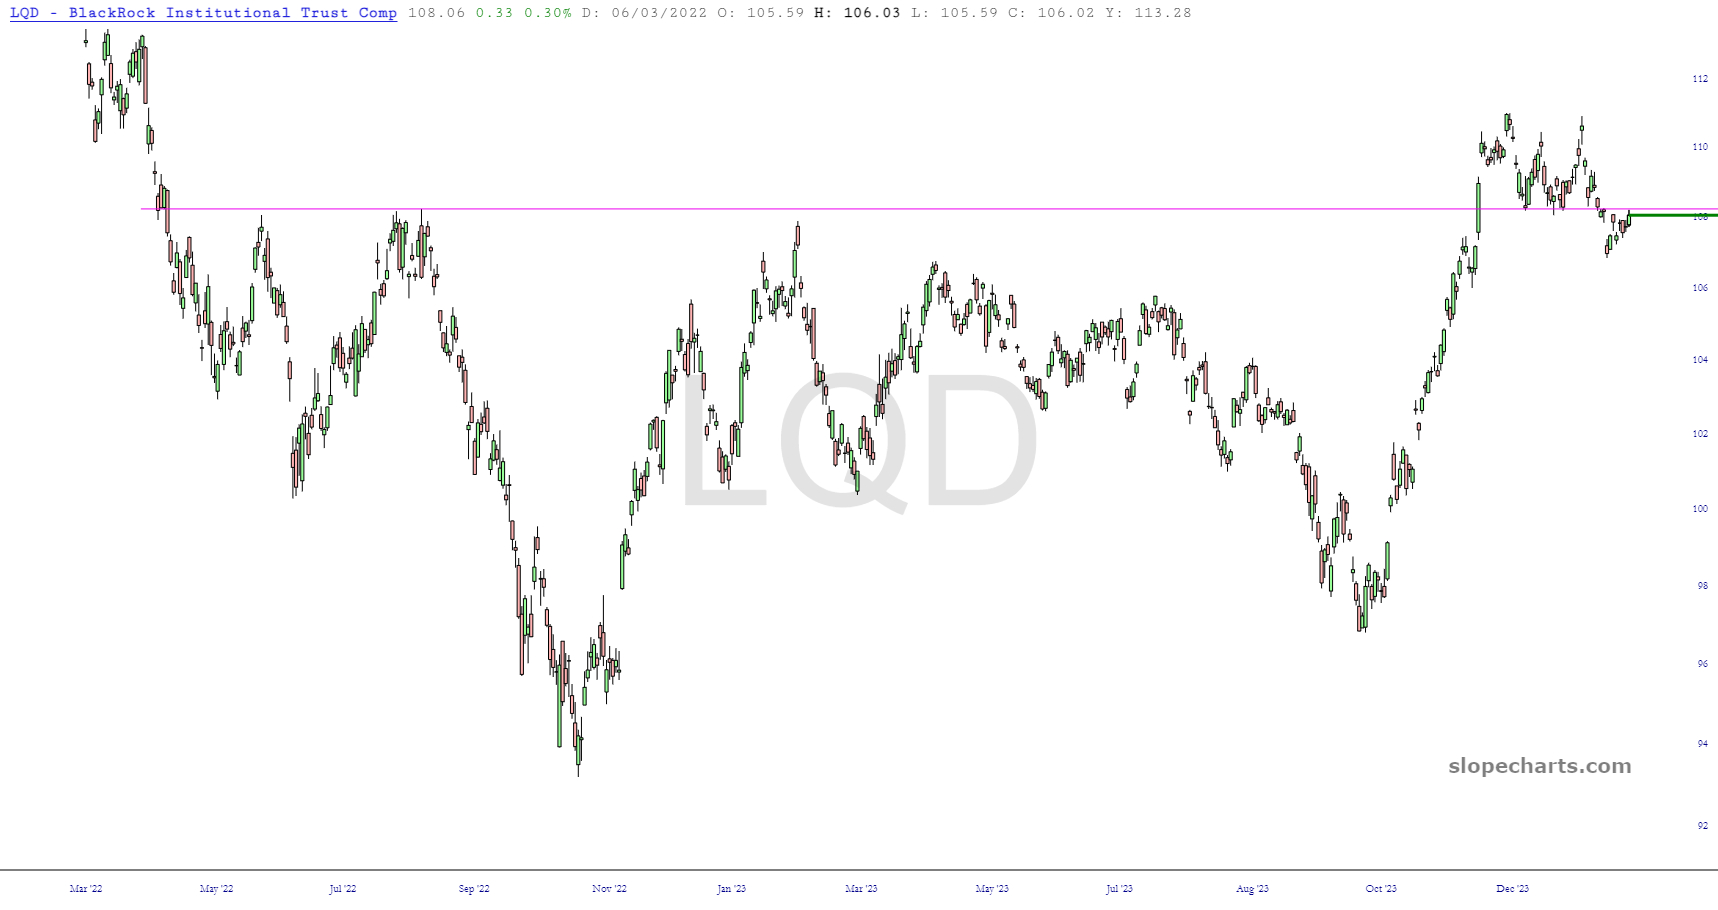
Finally, one very overlooked but important fact is that corporate bonds have broken support and are precisely at the resistance line represented with that horizontal. It would help the bearish cause immensely if bonds continued to weaken since, as the EW boys disturbingly put it, corporate bonds are just equities in drag.