
What’s this? Another feature on Slope? Good heavens!
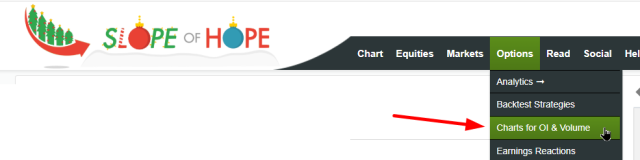
Yes, boys ‘n’ girls, we’ve introduced yet another cool new feature: the Options Volume and Open Interest page. Platinum members can get to it by way of this menu:
What this provides is a simple, easy-to-understand chart of where the concentration of volume and open interest is for any given symbol and expiration date. To use it, you just punch in a symbol, press Enter (or click Go) and then select an Expiration Date. Those are the only inputs. After that, you can just choose whether you want the Volume or Open Interest chart and select from any of three chart styles we offer.

Here, for example, is as line chart. The green represents call options, and the red is for put options. You can zoom in to any portion of any chart in the same way you do in SlopeCharts: just swipe the piece you’d like to see.

Here is the area style of chart, which is especially vivid. Since I’ve had my share of frustrations with thinly-traded instruments, it’s nice to have a means by which I can see where the meat of trading is.

As you mouse over a given chart, it will present to you a “tool tip” style box that highlights the strike price you are examining as well as the quantity of calls and puts contained for that price. You will also see the standard Download and Tweet buttons in case you want to preserve or share your chart.

If you’d like us to tweak any other aspect of this page, just drop me a line!
