
I was already bored an hour into the trading day, so I started browsing around the SlopeCharts data panel and remembered I hadn’t looked at the Statistics panel in ages. how delighted I was to fire it up and see this:
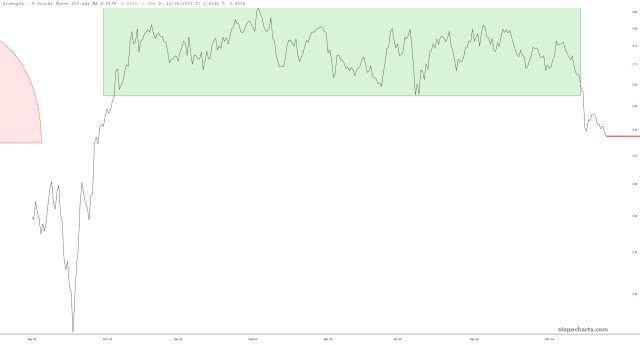
The chart is of symbol $SPX200MA which is the percentage of stocks above their respective 200-day moving averages. It was trapped for AN ENTIRE YEAR (green tint) banging around, grinding around, and going nowhere. Now, at long last, it has let loose, showing how stock strength is crumbling under our feet.
Good.
