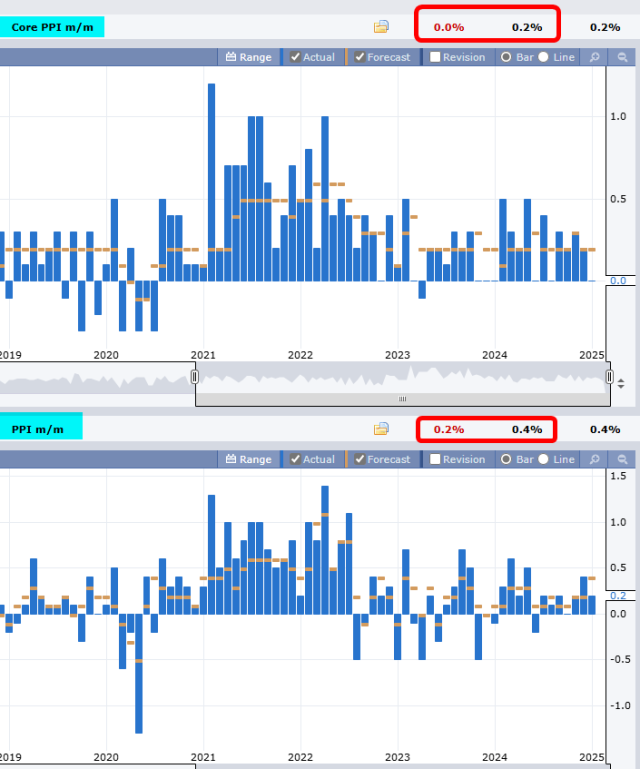
Every month, the inflation numbers (PPI on one day, and CPI on the other day) come out. I’m not sure why they flip positions, since sometimes it is PPI/CPI then others CPI/PPI, but this week it was the former. We just got the PPI numbers, and they are both ice-cold versus expectations.
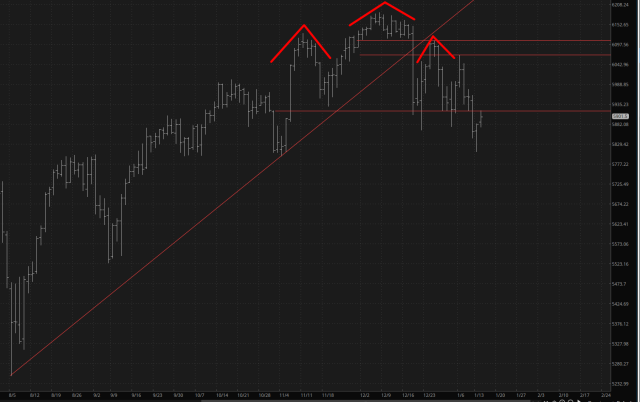
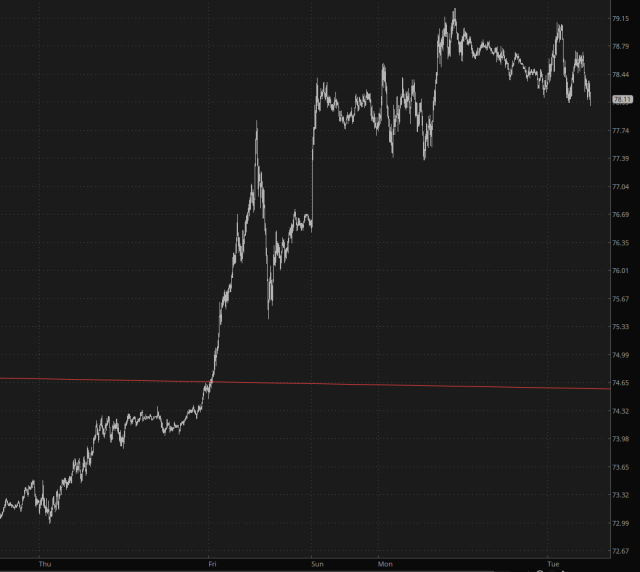
I was quite interested in what would happen vis a vis the H&S top I’ve been tracking on the /ES futures. The neckline is hard to place, because it isn’t a squeaky-clean pattern, but yesterday I decided that last Friday’s low would make a good anchor point (which is where the lowest horizontal is on this image).
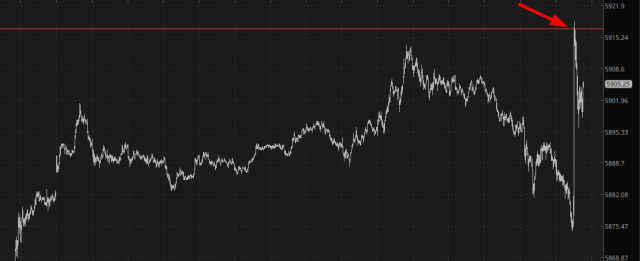
When the PPI came in with such bull-friendly data, all the stock futures exploded higher. The /ES went right up to the aforementioned red line (and just a kitten’s whisker above it) but, as of this composition, seems to be respecting it as resistance. As I’m typing these words, 60% of the mini rally is already gone.
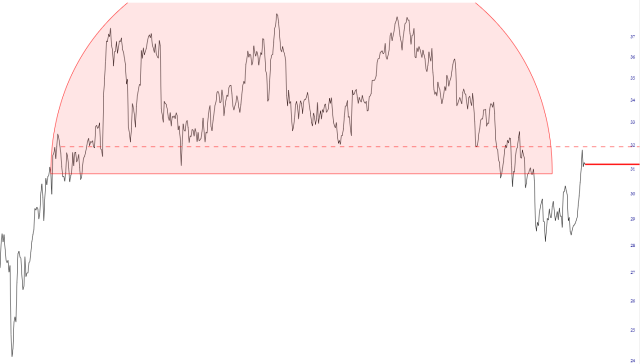
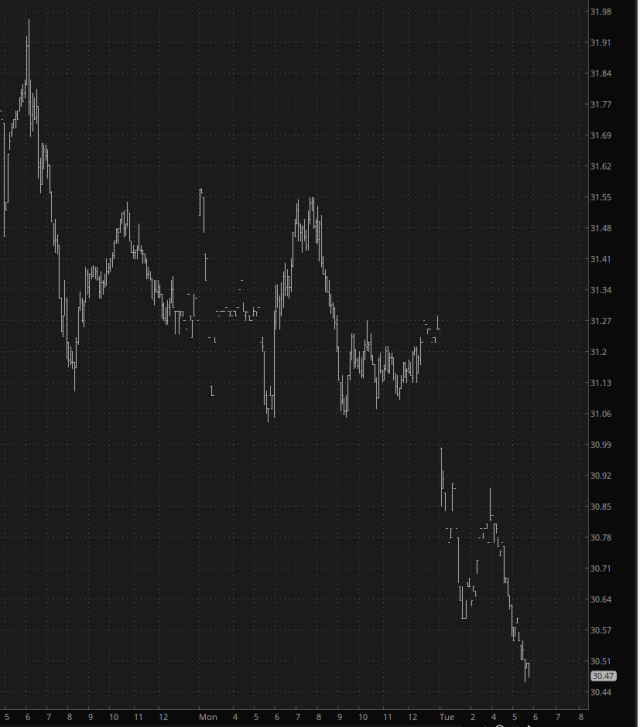
The VIX has likewise had the air let out of its tires.
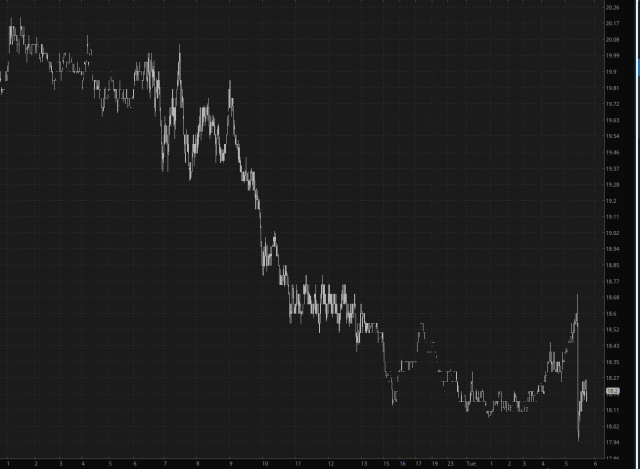
Yesterday was no picnic for me, because I actually lost ground on a day that was relatively red. Why? One word: energy. I was very heavy on energy plays, and oil’s big rally didn’t help at all. Crude oil is one of the few negative futures right now, and although I am not as aggressively positioned with oil producers as 24 hours ago, I’ve still got puts on BP, SLB, and OXY.
BP in particular is a good example of the kind of pattern I am trying to exploit. Over the past day, BP has shown some good weakness, and I acquired June puts on this sucker early on Tuesday.
My perception is that the bigger picture for oil producers is jumping-up-and-down bearish. Here is the line chart of BP on a daily basis which I hope drives this point home.