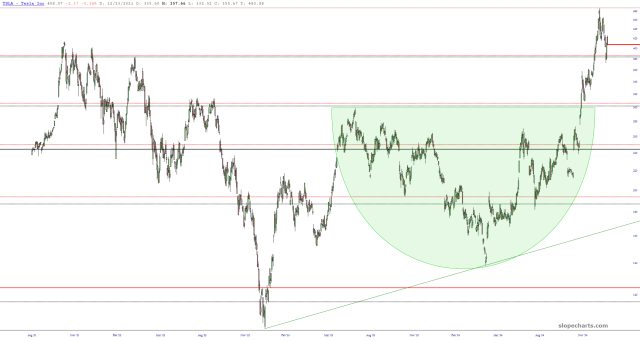
I’ve had Fibonacci Retracements drawn on the TSLA chart for literally years. Given the new lifetime highs, I’ve gone ahead and moved the anchor points up accordingly. It’s rather astonishing how, still, these lines have such powerful indicators of support and resistance zones.