
As traders, we know to be nimble, to quickly react when price turns against our thesis.
Last week was a good example of the current dubiously controlled markets – the tape bombs, the announcement of change from the former normal, the next issue that may, in a flash, change the market direction.
The best-looking setups don’t always play out, still, we place our bets from what the charts show us. Win or lose (remembering the biggest winner is a tiny loser), one thing we can be assured of is that the markets will provide another opportunity, directly; wait for it.
Here are charted technicals for CLX, ANF, NVDA and SOUN.
CLOROX
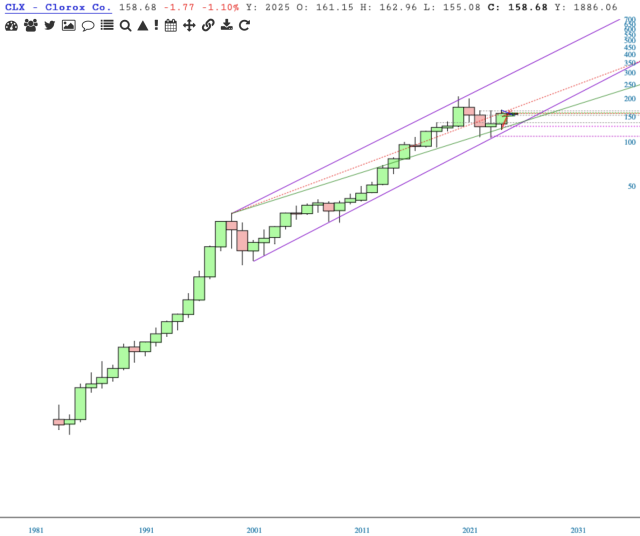
The yearly chart is good to start with because it shows the four and a half years since the CLX highs.
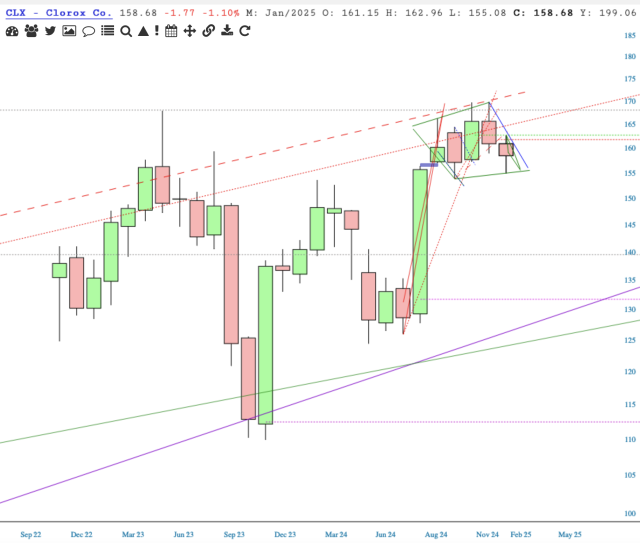
Reviewing monthly, price action for the past five is mixed, at best. Price is just a little over where we closed in August 2024. January closed 2.49 less than December.
Onto the daily chart – What is that heavy-looking, diamond-ish drawn object? Why, it’s a spaceship with sputnik! Note that the purple line of support is the bottom of the channel drawn from 2000. The top of that purple channel is too far gone to be in view. The top red dotted line is uptrend from 1999, another line of support, lost.
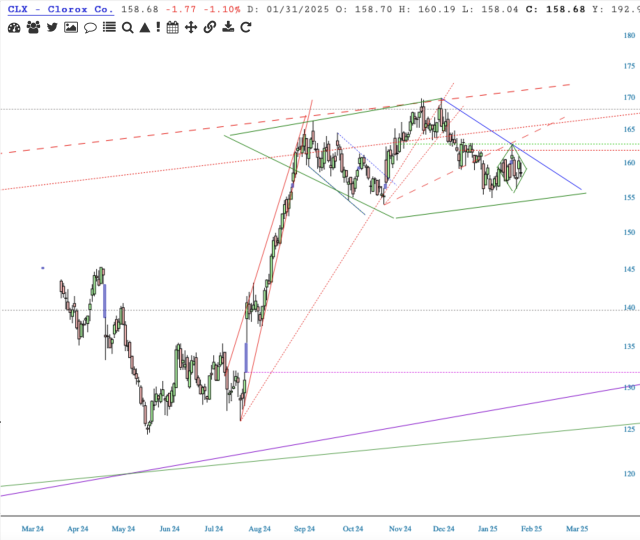
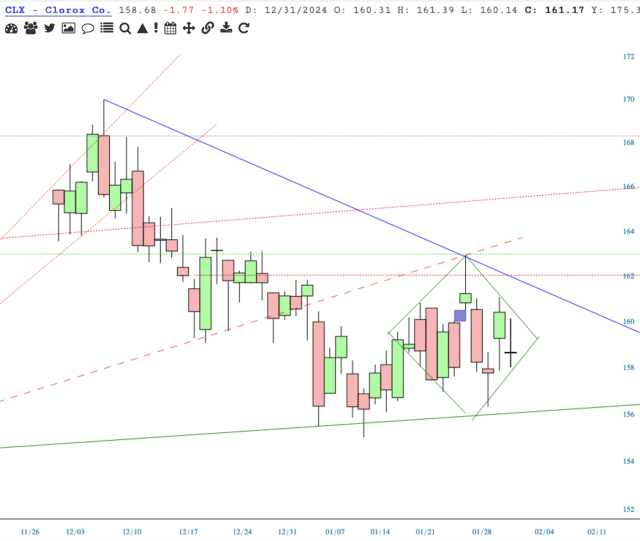
Speaking of diamonds, I drew one on the daily chart. Filling the gap at 131.98 is a reasonable target of a breakdown from this near-term diamond.
ANF
Powerfully-ripped abs may be slathered across their promotions, but don’t be fooled, ANF is a weakling.
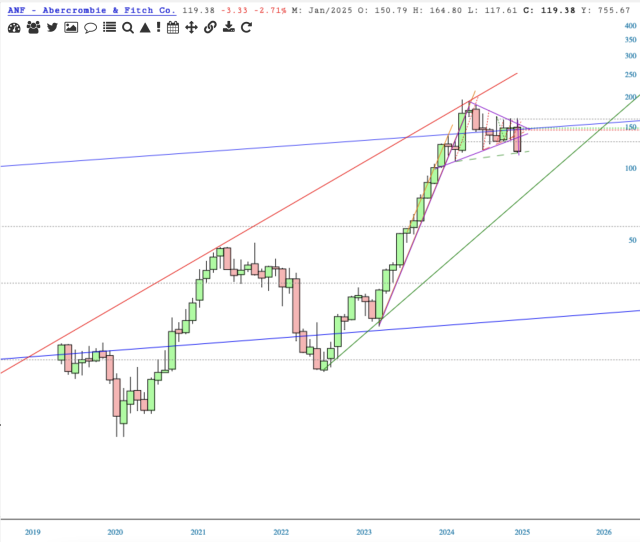
On the monthly chart, witness a triangle that has broken to the downside.
There’s that heavy-burdened flag on the daily chart. Note how the blue uptrend, top of the channel from 1999, cuts through the middle of the triangle and directly through the Ichimoku Cloud (red and green horizontal). Confluence is a good thing.
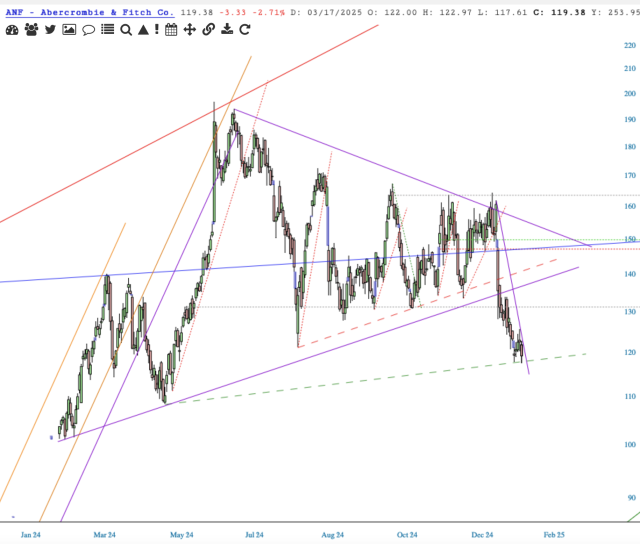
Looking for the next move south, we might use the “h”, with the dashed green line of support as the arbiter.
If it is an “h” that plays out, it is interesting to note the length of its leg down, compared the relatively small h body at the bottom.
Equally interesting to juxtapose that h layout, with the long steep rise begun in May 2023 culminating in the relatively small top triangle.
All in all, ANF has no muscle to speak of.
NVDA
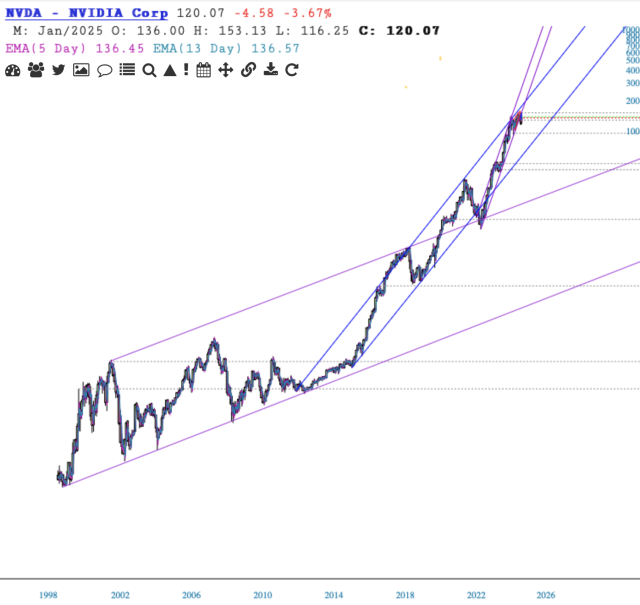
In 2024, going up against the top of the purple channel from 2022, NVDA tried, twice, but couldn’t stay up and out of it. That’s big deal number one.
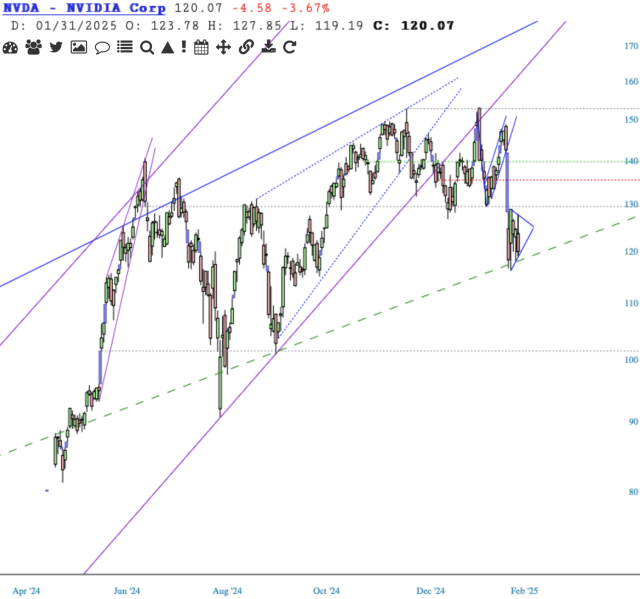
Big deal number two is that price fell away from resistance of the top of the blue channel off the 2012 low.
Big deal number three will be falling out of the triangle which should take it down around 100.
SOUN
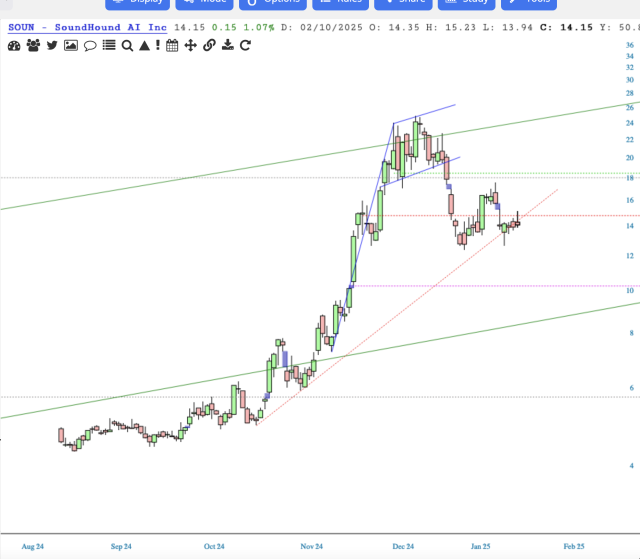
SOUN lost its chance for new highs when price broke down from a bearish rising flag in early January. Here we have another issue where price doesn’t make it past the resistance of a (green) channel top.
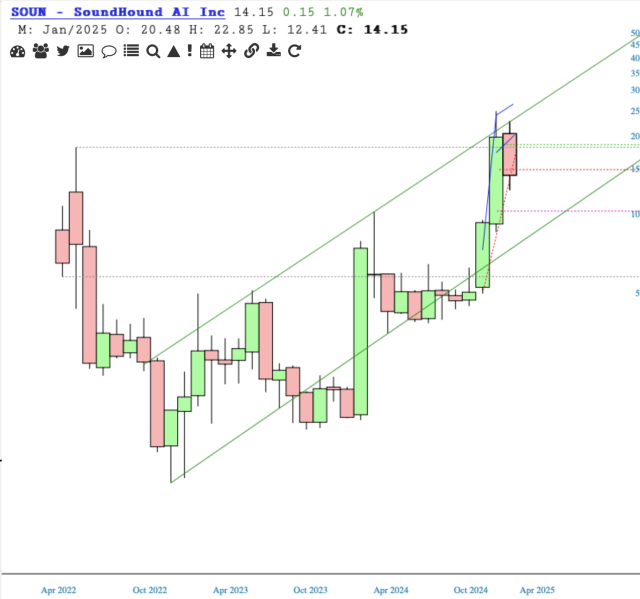
By length of the flagpole, it’s reasonable to use the tiny gap fill at 10.30 (fuchsia) as target of the flag break.
Happy technical trails to you.
