
In my post yesterday I was looking at the very nice rally setup that triggered with the rally on Friday and that looked very promising. It might have failed in any case but yesterday Trump delivered a major news bomb when he confirmed that the threatened tariffs on Canada and Mexico would be implemented today, and that further tariffs would be implemented on China, and markets have been dropping hard since then. There is currently every reason to expect that these will be followed by further tariffs on the EU next month, so we may well be looking here at the start of a global trade war. Canada had already announced retaliatory tariffs against the US, in the event of the US imposing 25% tariffs, that will now also be implemented and there is good reason to expect that the EU will react the same way. China is already retaliating of course.
What does this mean for markets? Well the last serious trade war initiated by the US was with the Smoot-Hawley tariffs in 1930, and that didn’t go well for equity markets with a drop from the Dow high at 294.07 in 1930 to the low at 41.22 in 1932. There is a significant argument that it helped transform the 1929 crash from a 50% correction into the almost 90% disaster that it became, and turned a nasty recession after the 1929 crash into the Great Depression of the 1930s. If this grows into a larger trade war then I’d expect higher prices and interest rates across the board in developed economies and very possibly recessions across the board too. We’ll see.
In the short term this was a failed break up and this would generally deliver at least some more downside and may well deliver a lot more downside. This brings us back to my post on Wednesday 19th Feb where I was looking at the very nice looking topping setups on SPX, QQQ and DIA and so I’m going to review those setups today.
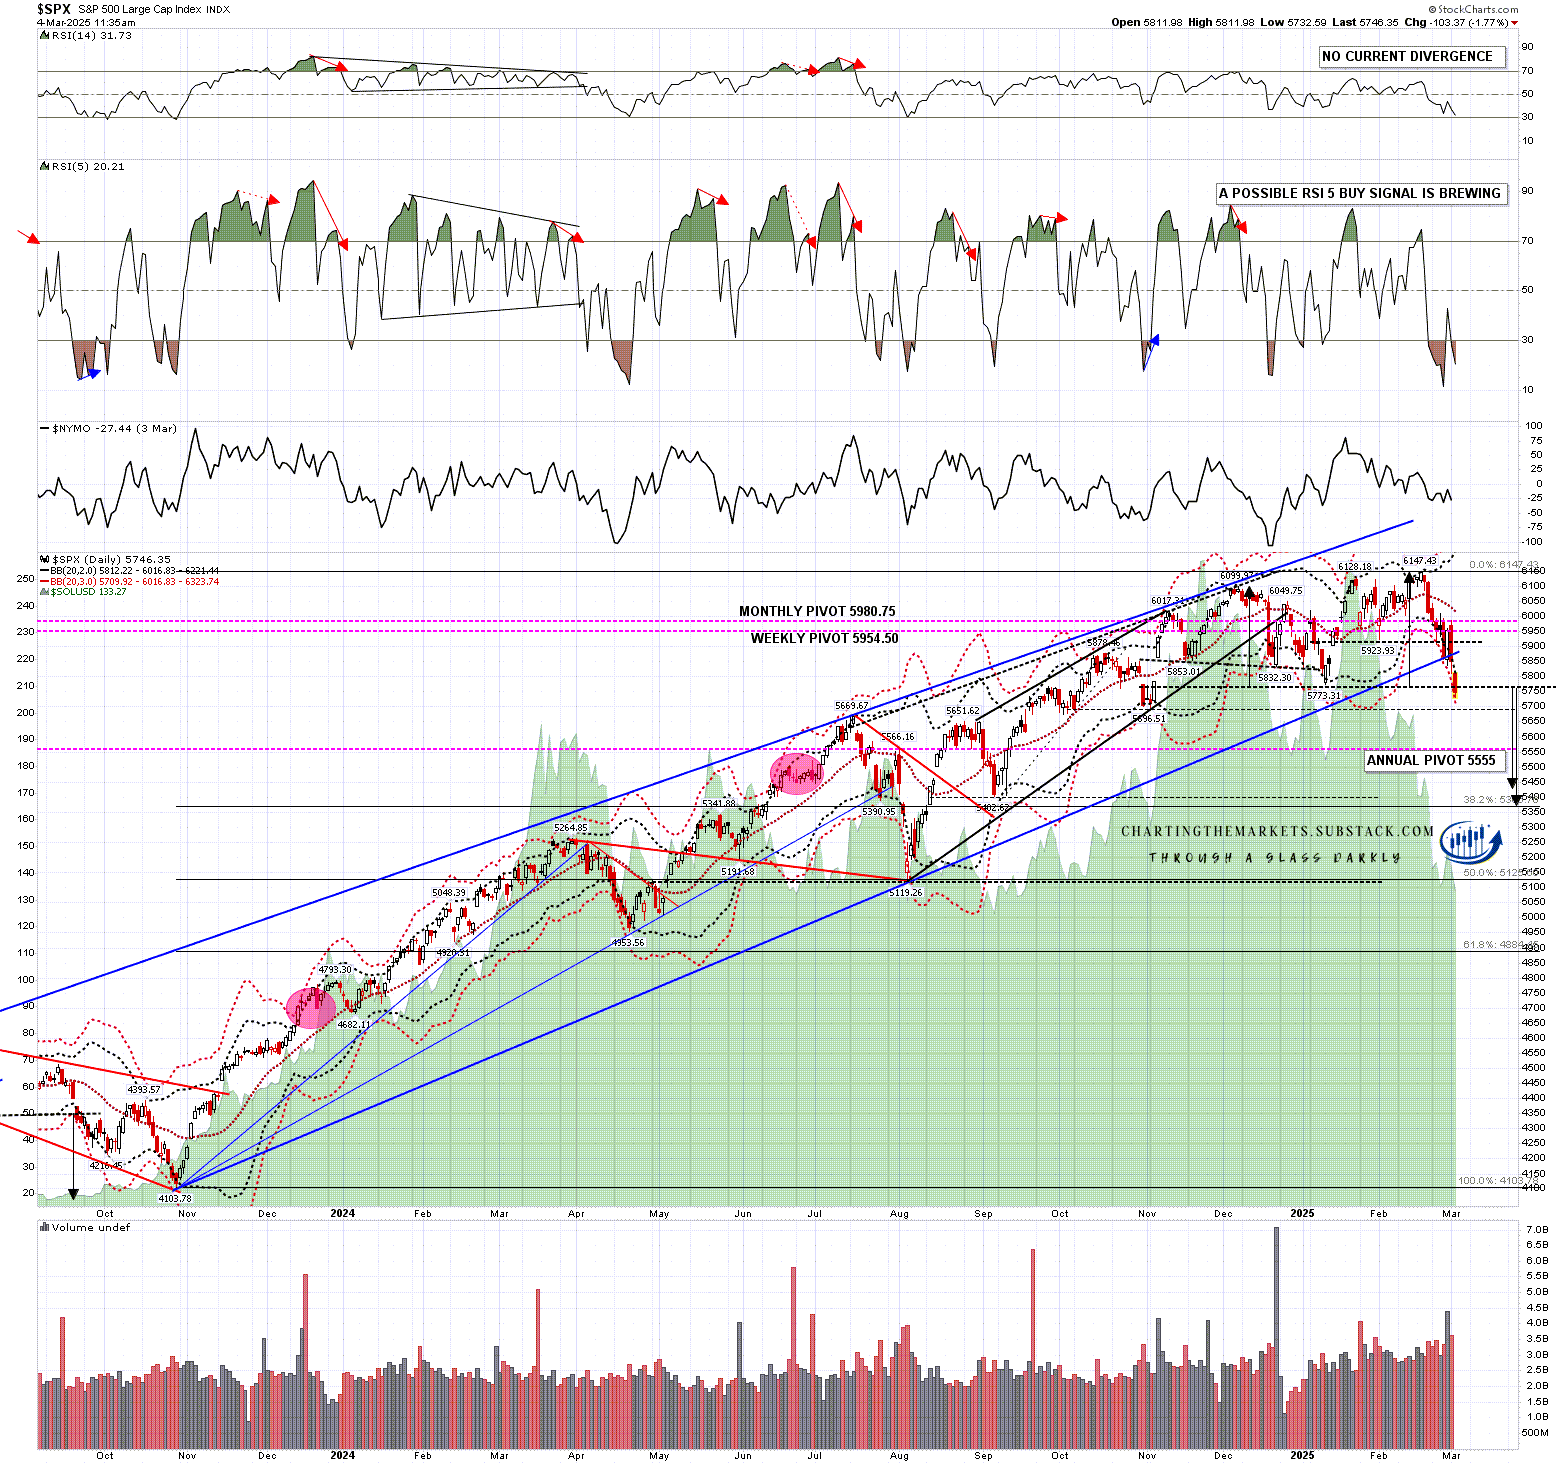
On SPX the bearish pattern setup is a nested double top.
On the first and smaller double top setup a sustained break below 5923.93 would look for a target in the 5720 area. This broke down last week.
On the second and larger double top setup a sustained break below 5773.31 would now look for a target in the 5418 – 5447 area. This has now also broken down.
If this full nested double top setup delivers this retracement would retrace a bit more than 61.8% of the rising wedge from the August low at 5119.26.
I would note that there is now a very nice possible daily RSI 5 buy signal brewing so if there should be a change in policy direction this could deliver a strong rally.
SPX daily chart:
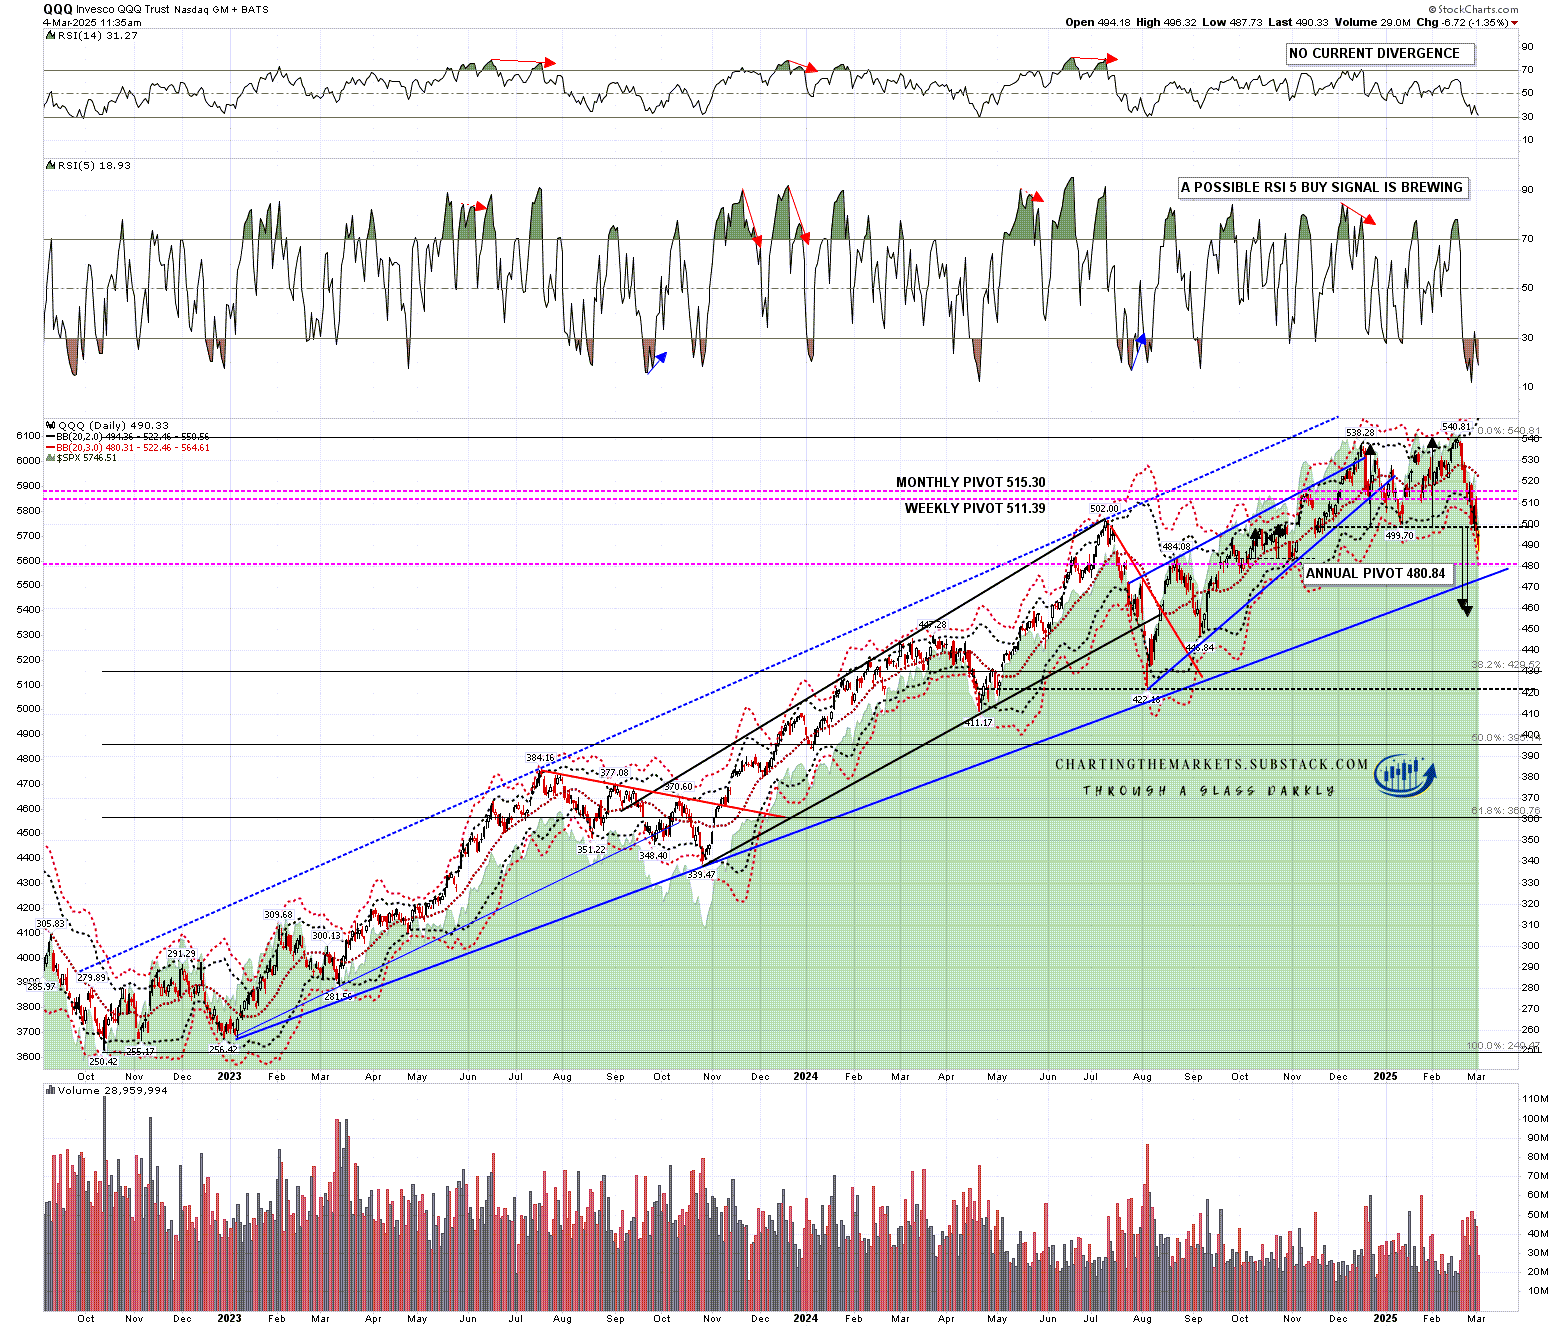
On QQQ the new all time high had set up a good quality double top. A sustained break below 499.70 would fix a double top target in the 459.40 to 461.10 range. This has now also broken down.
If this setup delivers this retracement would retrace a bit more than 61.8% of the rising wedge from the August low at 422.18.
I would note that there is now a very nice possible daily RSI 5 buy signal brewing so if there should be a change in policy direction this could deliver a strong rally.
QQQ daily chart:
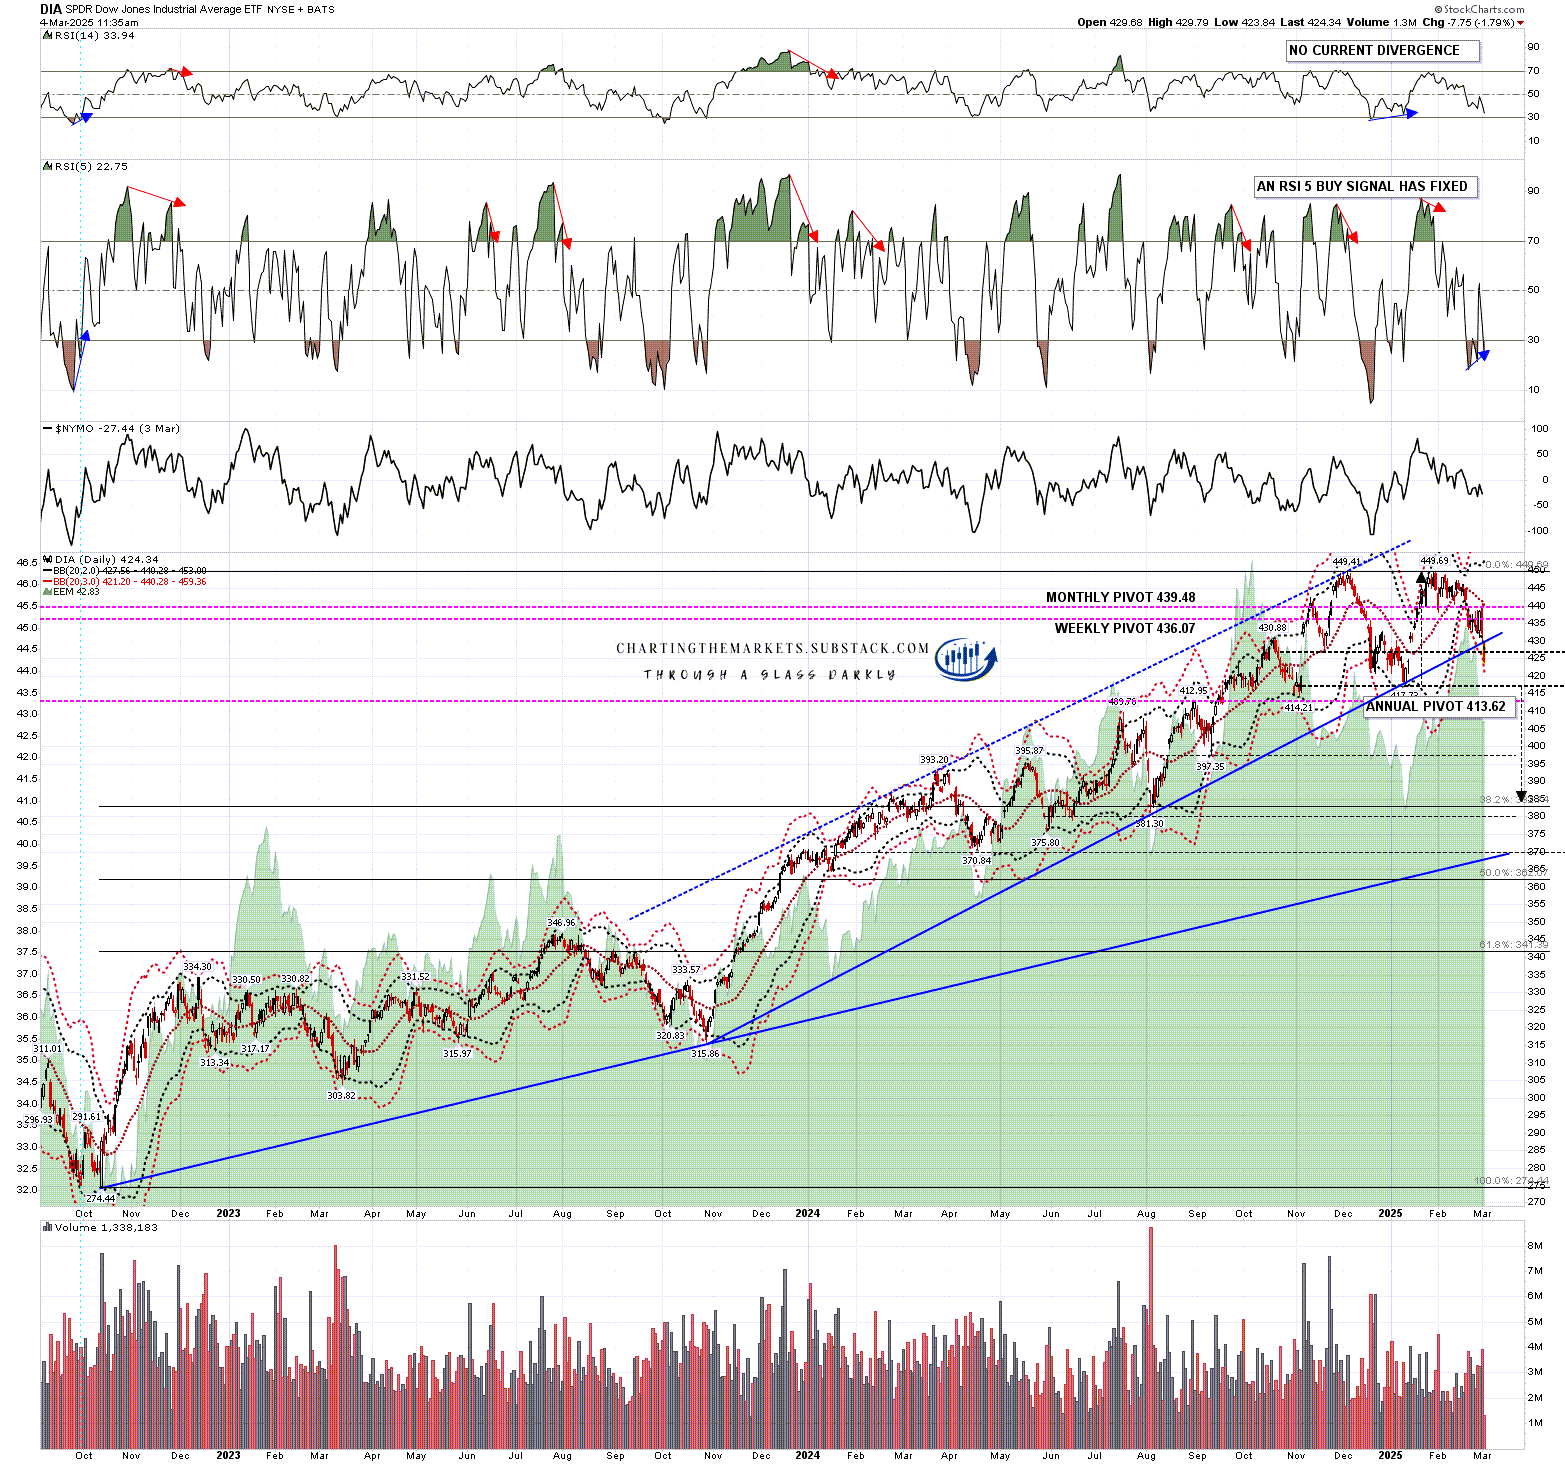
There was also a high quality double top setup on DIA, and on a sustained break below 418.35 the double top target would be in the 386/7 area, almost a full retracement of the rising wedge on DIA from the August low at 381.87. This pattern is the only one of the four topping patterns I posted on SPX, QQQ, DIA and IWM on Feb 19th that has not yet broken down but may well do so soon.
A daily RSI buy signal has already fixed on DIA and may still have a shot if there is a policy change.
DIA daily chart:
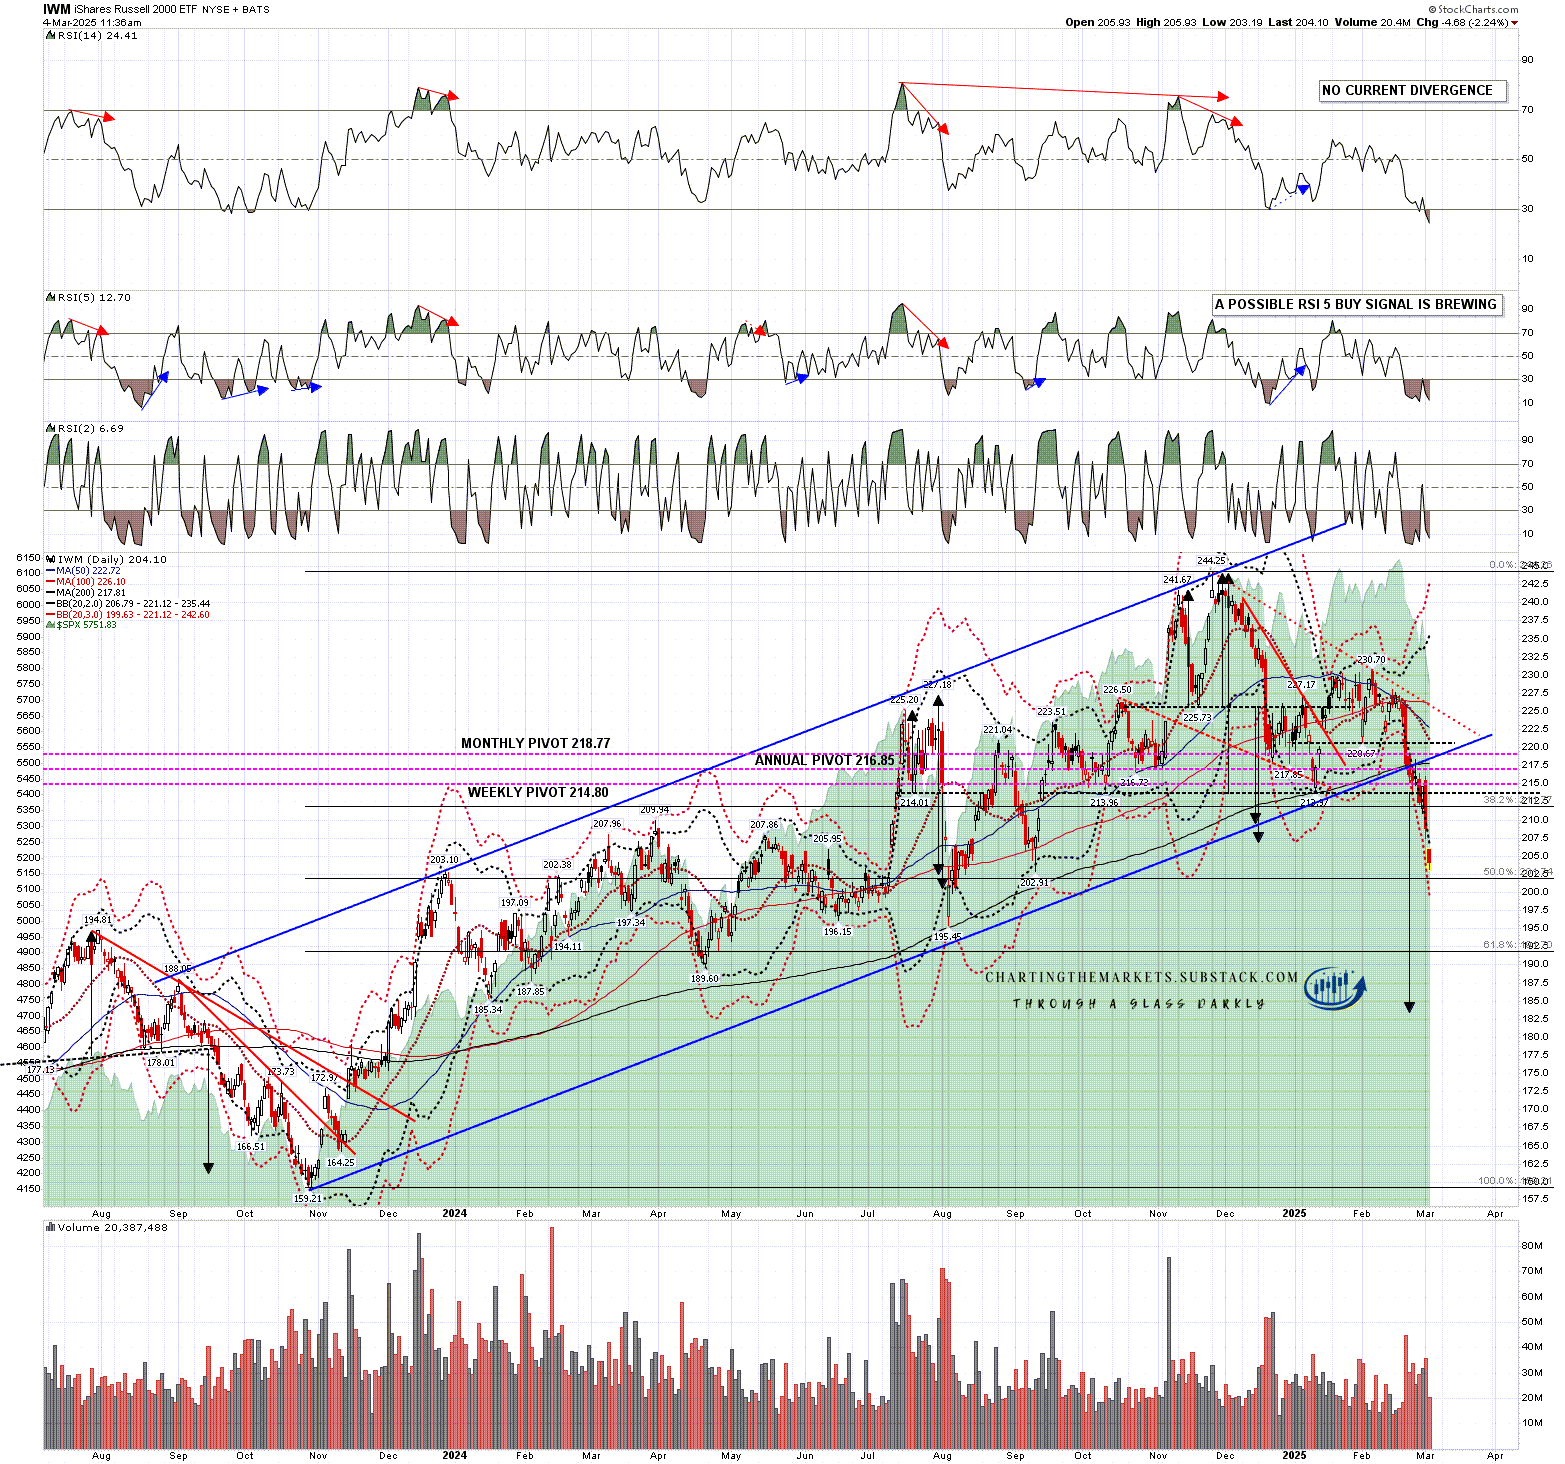
I noted on Feb 19th that IWM was already in a technical downtrend, and that the double top target area 207 to 209.5 that fixed in December was still valid. That target was reached yesterday.
There was also a possible much larger H&S forming that on a sustained break down below 213.97 would look for a target in the 183.70 area, and that has since broken down too.
I would note that there is now a very nice possible daily RSI 5 buy signal brewing so if there should be a change in policy direction this could deliver a strong rally. That said, a bit more downside that holds into a daily close would kill this divergence.
IWM daily chart:
I was saying on Feb 19th that ‘I’ve been expecting to see some market turbulence in the first half of this year, and the imposition of new tariffs on many of the trading partners of the US is a possible trigger to see that turbulence. I’ve been reading that Trump’s administration is considering a position that the value added (sales) taxes levied across Europe may in effect be tariffs. That’s absurd, as those taxes apply to all sales regardless of the source, but if retaliatory tariffs started being levied against Europe on that basis, then a trade war with Europe would seem likely as a result. That could significantly disrupt world trade and markets. ‘ Not much to add to that today.
I also said ‘it’s hard to say what the knock-on effect on inflation and growth might be, other than to say that the obvious lean would be towards inflation rising and growth falling’. Not much to add to that today either.
I would say that I’m not convinced that the Trump administration will stick to this tariff policy direction in the event that there is serious market turbulence, but markets may need to be a lot lower before it is prepared to consider a change in direction. In the meantime all these topping patterns are looking good and may well all deliver.
As I have been since the start of 2025 I’m still leaning on the bigger picture towards a weak first half of 2025 and new all time highs later in the year, very possibly as a topping process for a much more significant high. One way or another I think we’ll be seeing lower soon and I’m not expecting this to be a good year for US equities, not least because both of the last two years have been banner years for US equities. A third straight year of these kinds of gains looks like a big stretch. I could of course however be mistaken.
If you like my analysis and would like to see more, please take a free subscription at my chartingthemarkets substack, where I publish these posts first. I also do a premarket video every day on equity indices, bonds, currencies, energies, precious commodities and other commodities at 8.45am EST. If you’d like to see those I post the links every morning on my twitter, and the videos are posted shortly afterwards on my Youtube channel.
