
Since the close on Thursday, the market has been through four big movements, shown below:
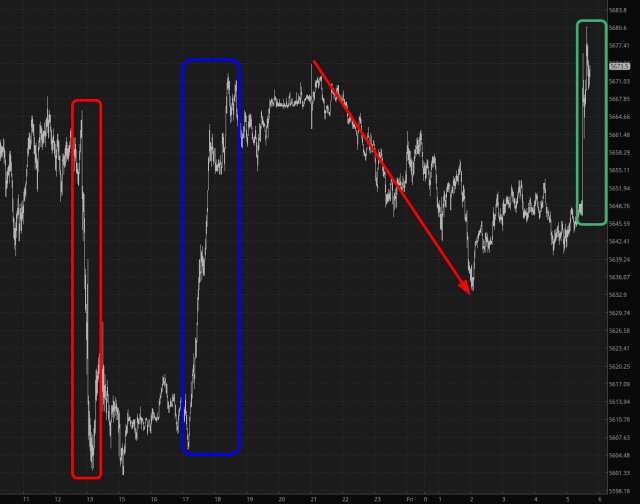
- The red rectangle denotes when AAPL and AMZN did their earnings reports which, in sharp contrast with MSFT and META the day prior, were both duds.
- The blue rectangle marks when rumors began to swirl that China and the U.S. were – gasp! – talking about a trade deal. This “trade talks are going well” schtick is probably going to be with us for months to come, which is truly fresh Hell. In these latest “talks”, neither side could even agree who made the first call, so you can imagine how well these negotiations are going to go on the tough stuff.
- The red arrow was the steady sink in values through the night since the people of Earth slowly realized that rumors of talks don’t mean much.
- Finally, the green rectangle is the pop we got from the jobs report, as bad earnings from Mag 7 stocks have been rendered meaningless.
Thus, barring some big surprise during Friday’s normal session, we’re in for the 9th day in a row of the stock market going up, which hasn’t happened in literally decades.
There’s plenty of talk these days about bias in media (indeed, it looks like the White House is going to pull all funding from NPR and PBS since it is “biased“), but let’s look at some real bias, and not from some fringe source, but from no less an esteemed publication than Bloomberg.
Give this a read:
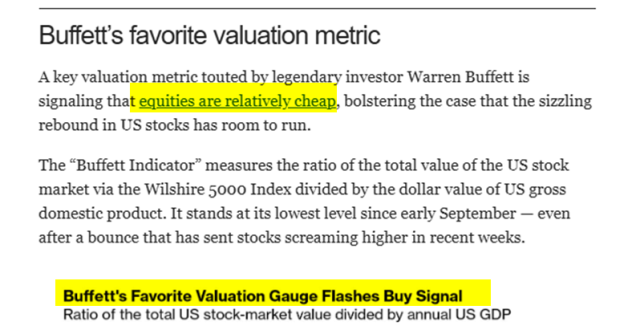
Since virtually no one reading such a piece would have any context at all, they would take the article at its word and assume that stocks were, as plainly stated, “cheap.”
How about we take a peek at the truth instead?
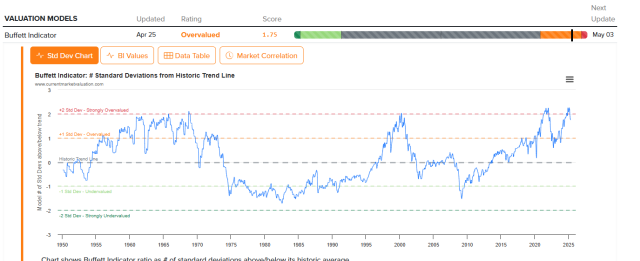
This chart, from the good folks at CMV, illustrates that over a period of many decades the Buffett Indicator is EXTREMELY high (+2 standard deviations), with very times in history at these lofty levels, and that doesn’t even include any of the gains from this week (which I remind you, is five up days in a row)!
In 1981, stocks were cheap. In 2009, stocks were cheap. Just because stocks are a little less INSANE doesn’t mean they are “cheap“! It’s the equivalent of saying a very ill person with a fever that has gone from 105 to 104.8 is healthy. It’s absolutely false, and a shameless lie, but hardly anyone is going to know any better.
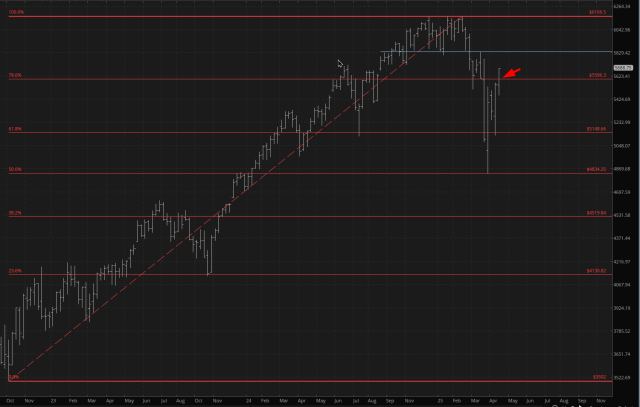
In any case, the markets are raging right now, and the last meaningful barrier, the 78.6% Fib level has been kicked aside effortlessly. The last wispy hope for the one or two surviving bears left on the planet is that blue line, which merely represents the Wave Two bounce that peaked on March 25th.
Rest assured I’ll be taking a very steely-eyed look at all the updated index and ETF charts this weekend and seeing where we stand. In the meanwhile, good luck today, and congratulations to the bulls on their extraordinary run over the past two weeks.
