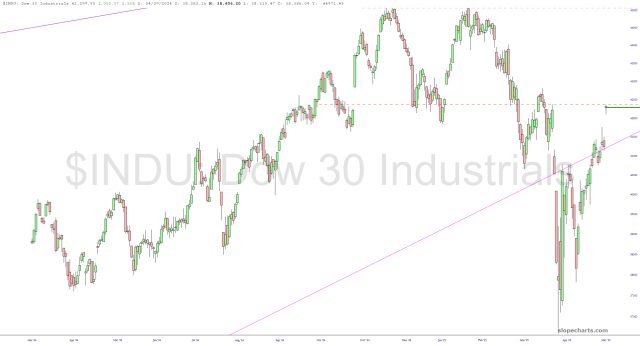
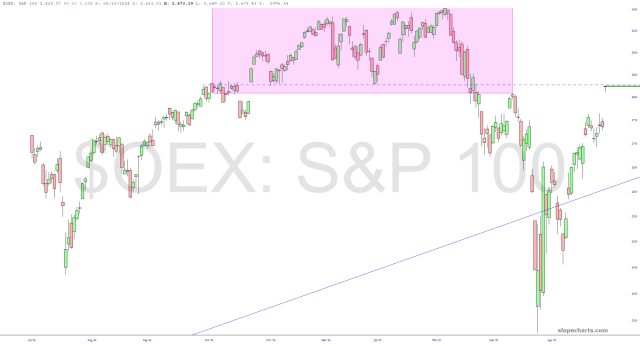
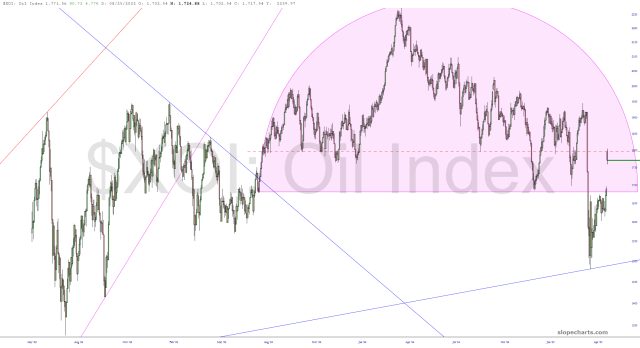
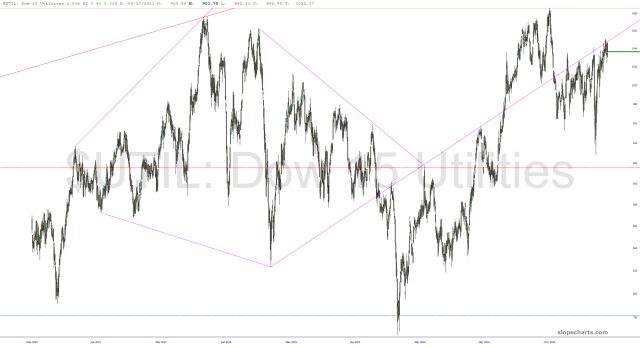
Today’s mega-rally (with quadruple points on the Dow) changes the landscape, to be sure. The bears are very down, but not totally out. Below are five index charts on which I’ve drawn the lower level of what I consider important overhead supply. The one that’s different than the rest is the last chart, the Dow Utilities, whose resistance level is a long-term trendline as opposed to a horizontal.