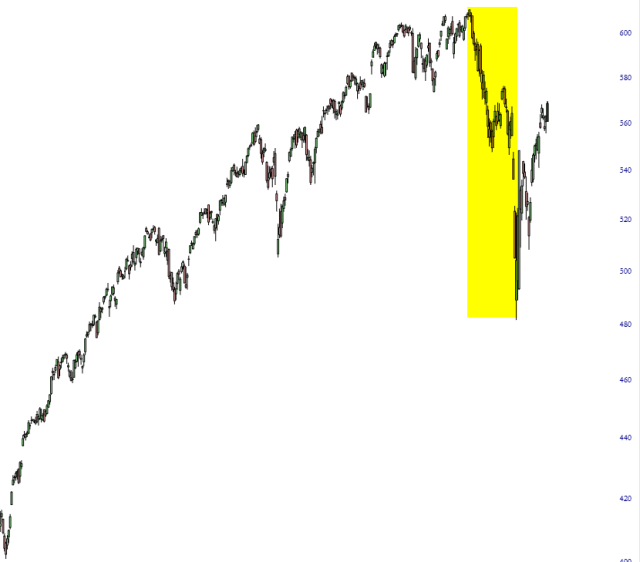
In my post on 17th April I posted some 15min charts with arrows showing an ideal path to forming bear flag wedges on SPX, QQQ and DIA. I added one for IWM in the post after that. I’ve updated these since but left the original arrows where I first drew them for reference on the last four charts today so you can see I wasn’t that far off.
In my post on Tuesday 29th April I was saying that ideally we would see a modest decline (by recent standards) to play out some negative divergence on SPX, QQQ, ES and NQ and we saw that play out over the next few days with all the hourly and 15min sell signals I mentioned in that post reaching target. After that I was looking for another and probably last leg up within those bear flags and since then we have seen new rally highs on all four.
In my last post on Thursday 1st May I was looking for more upside with a likely high early this week, and that hasn’t quite delivered, though I think there is a good case for seeing my target area hit today or tomorrow.
(more…)