There is a tremendous variety of economic charts on Slope, and I decided to thumb through them and pluck out some of the most interesting ones for you. Descriptions are in the captions below.
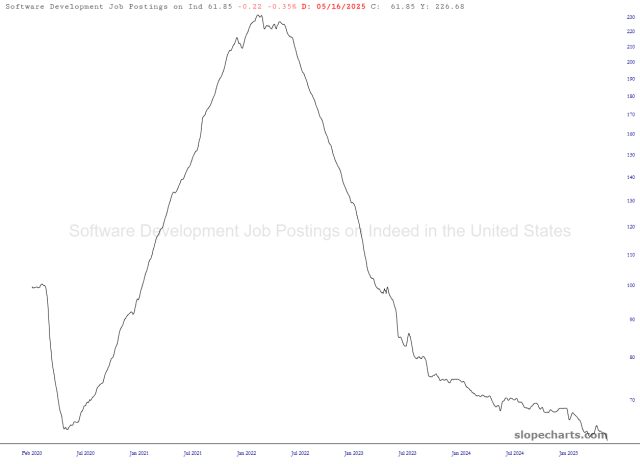
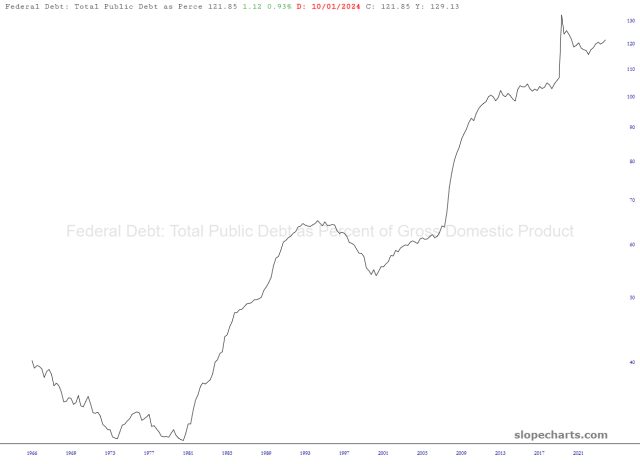
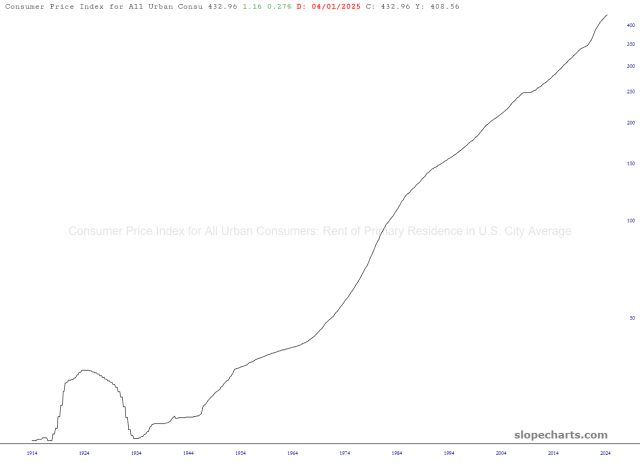
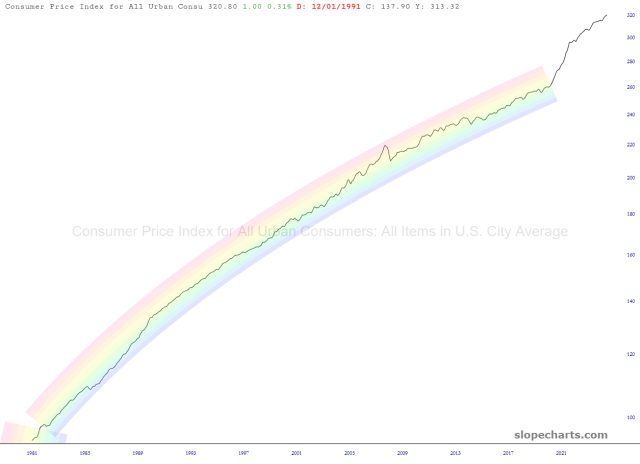
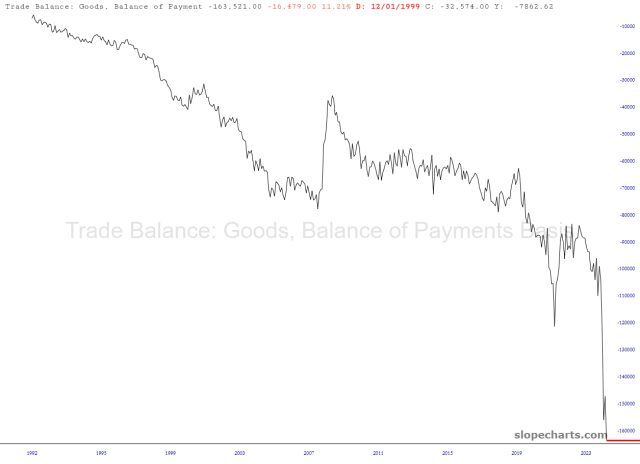
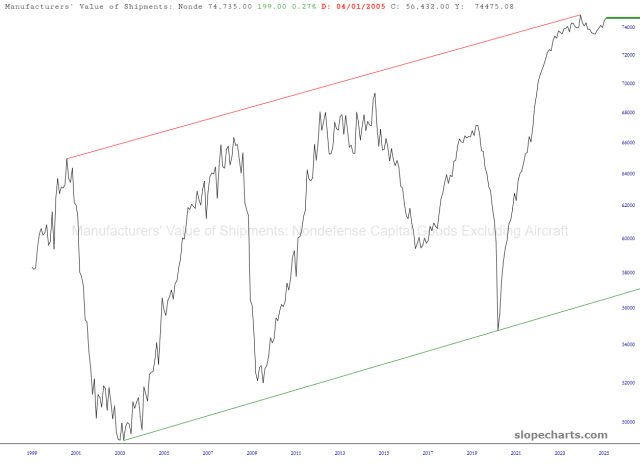
consumer sentiment has plunged to some of the lowest levels in history; I’d say the everyday public has a better sense of what’s coming than economists would like to thinkgot a computer science degree from a top school? that’ll give you hundreds of thousands in debt, but not much in the way of a job – – the openings have withered away from the 2022 maniaI find it odd when I read about how one day the federal debt will actually exceed our GDP; that train has already left the station! We’re well into triple digits, and on our way to four if we keep going………the Federal Reserve continues to do a crackerjack job with inflation control, as the consumer price index makes clearhere’s the longer-term view of the CPI, illustrating that even after decades of inflation, we outdid ourselves thanks to the inventio of Wuhanhow’s our trade situation going? let’s ask the trade balance!and as for bringing manufacturing back to Americuh, not only is that not going to happen, but the manufacturing that we are still managing to do here looks like it’s about to head into a free-fall, if multi-decade history still applies