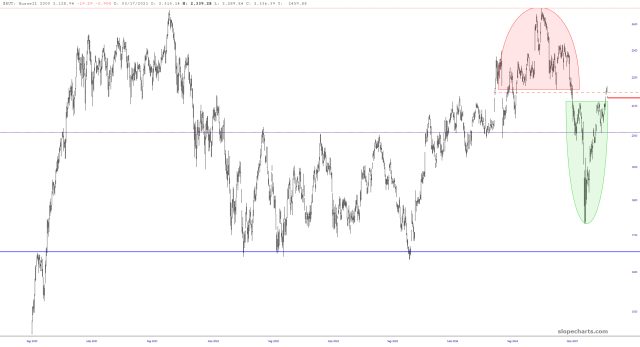
Since yesterday morning, a fascinating transmogrification has taken place with the small caps, as represented by the /RTY futures. I am a bit obsessed with this, not only because I consider the $RUT to be the “last man standing” in bear-land, but also because I happen to own a whole bunch of August $212 puts on IWM. Here’s the /RTY since yesterday morning:
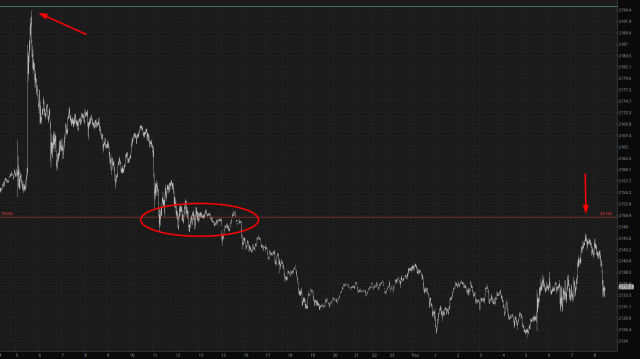
So, what we have here are three important events:
- the arrow on the left represents the knee-jerk reaction to the jaw-dropping CPI that came out yesterday morning; it went flying higher toward the base of the bearish pattern but, thank God, it didn’t cross it;
- the oval represents the stalling of prices at the major Fibonacci level, illustrating a slow transition of that line from support to resistance;
- this morning, as the small caps trying to erase their losses, it approached the Fibonacci at the arrow but, failing to even tag the line, it got exhausted and fell away
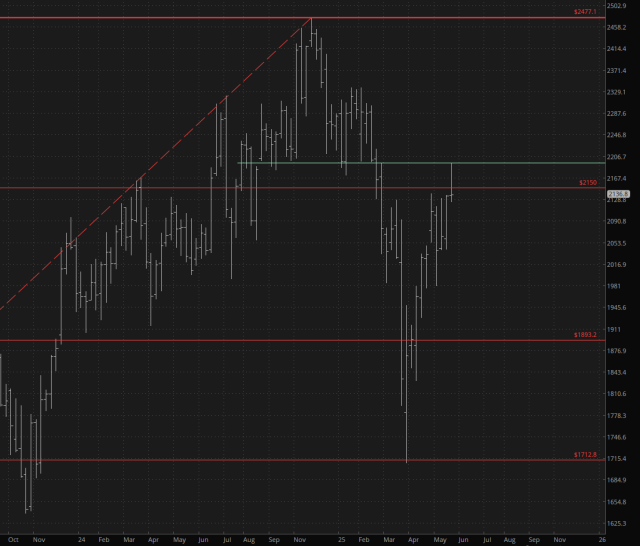
While the above chart is based on minute bars, the one below is the same market but with much cruder weekly bars. As you can see, the topping pattern above the green line remains intact (barely!) and, at the moment, we are just below the $2150 Fibonacci resistance. This is a crucial area to remain beneath if the bears (and my puts) are to have a prayer.
Here’s an updated image of the cash index itself, the Russell 2000 $RUT: