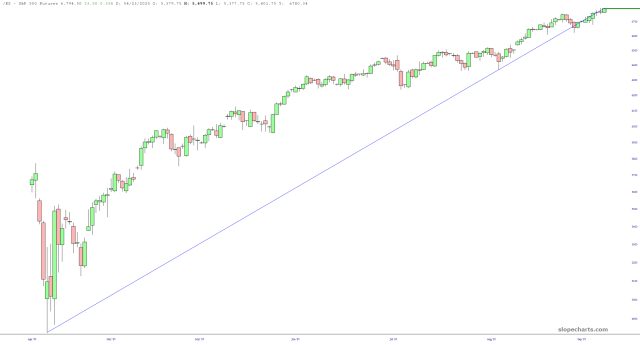
The rigid consistency of the /ES and its utter inability to stray from this lengthy trendline is jaw-dropping.
Slope initially began as a blog, so this is where most of the website’s content resides. Here we have tens of thousands of posts dating back over a decade. These are listed in reverse chronological order. Click on any category icon below to see posts tagged with that particular subject, or click on a word in the category cloud on the right side of the screen for more specific choices.
The rigid consistency of the /ES and its utter inability to stray from this lengthy trendline is jaw-dropping.
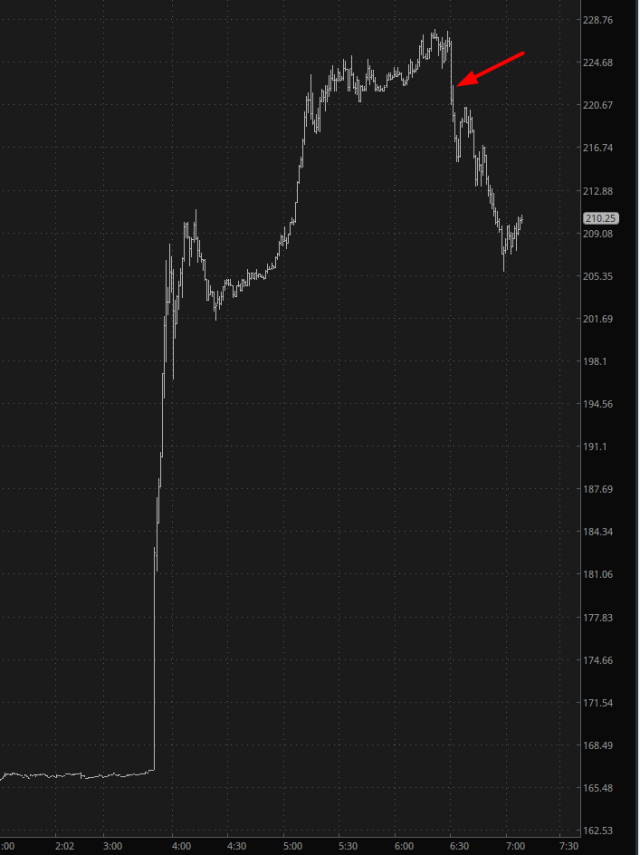
I’ll start by saying my covering of AMD couldn’t have gone much worse. I had a short position, and in spite of AMD being quite a large company, its pre-market market prices were up about 36% (AKA not a good morning to be short). I am very disciplined in my trading, and my stop-loss orders are always in place. On extremely rare occasions I’ll temporarily remove such orders, but this time I kept it in place and basically got out at the worst possible price.
In my post on Friday 26th September I was putting the case that the modest retracement that we saw that week might well be over, and in my post on Monday 29th September I was outlining the still possible option that we might nonetheless see another leg down on US indices, though I was assigning that a low probability.
Equity indices resolved higher as expected, and we have seen new all time highs made last week on SPX, QQQ, DIA and IWM. My personal view is still that US equity indices are likely heading higher into the end of the year unless we start seeing strong breaks of the support at the daily middle bands that were backtested and held on SPX, DIA and IWM in the late September lows.
How will that be affected by the current government shutdown? Well that rather depends on how long it lasts, and the longer that lasts the more likely it is that we see equity markets weaken. Looking at the chart below there is a significant negative lean historically for these though I’d note that of the twenty government shutdowns listed on the chart below, the last five starting in Nov’ ‘95 all closed green, with a real outlier in the last one in December ‘18 which was the most bullish shutdown since 1976.
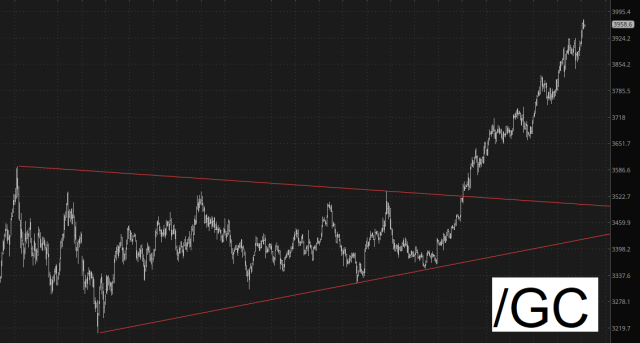
(more…)If there’s been one consistent winning sector this year, it’s precious metals. All the ratio charts and long-term projections have pointed to that, and, importantly, the Big Round Number of $4,000 on gold seems almost inevitable at this point. Gold has exhibited one of the cleanest symmetric triangle breakouts I’ve ever seen. Crossing $4k will generate a lot of press and excitement, although I suspect, short-term, it would soon be followed by a “Sell the News” kind of weakness.