Below are the most interesting charts I have examined from my Futures watch list. I have put some remarks in the caption of each chart.
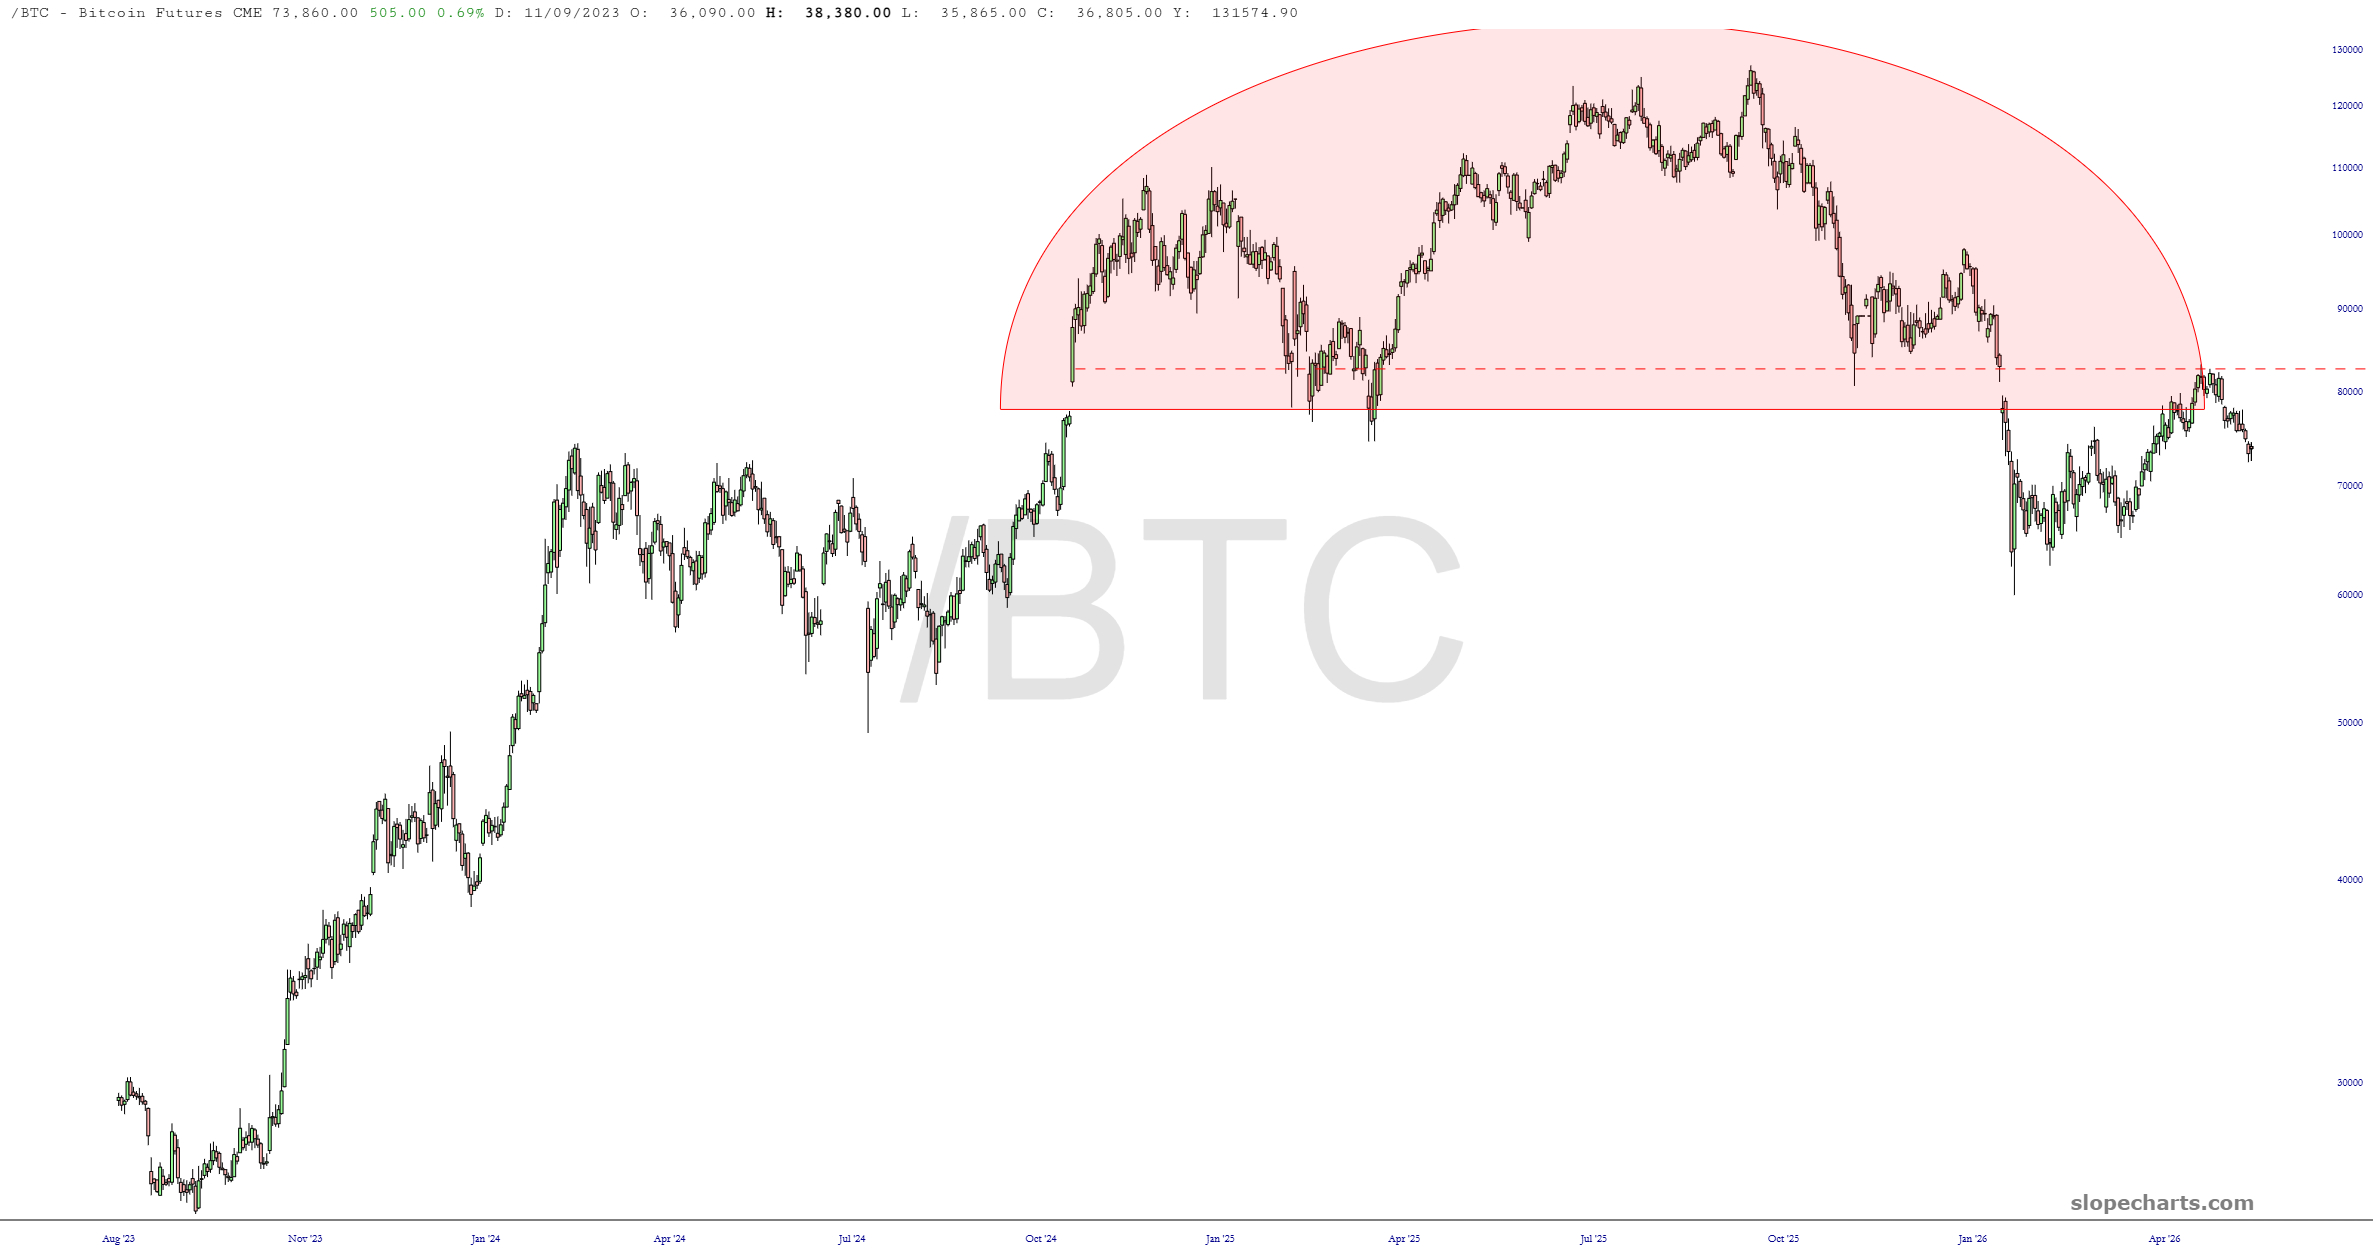
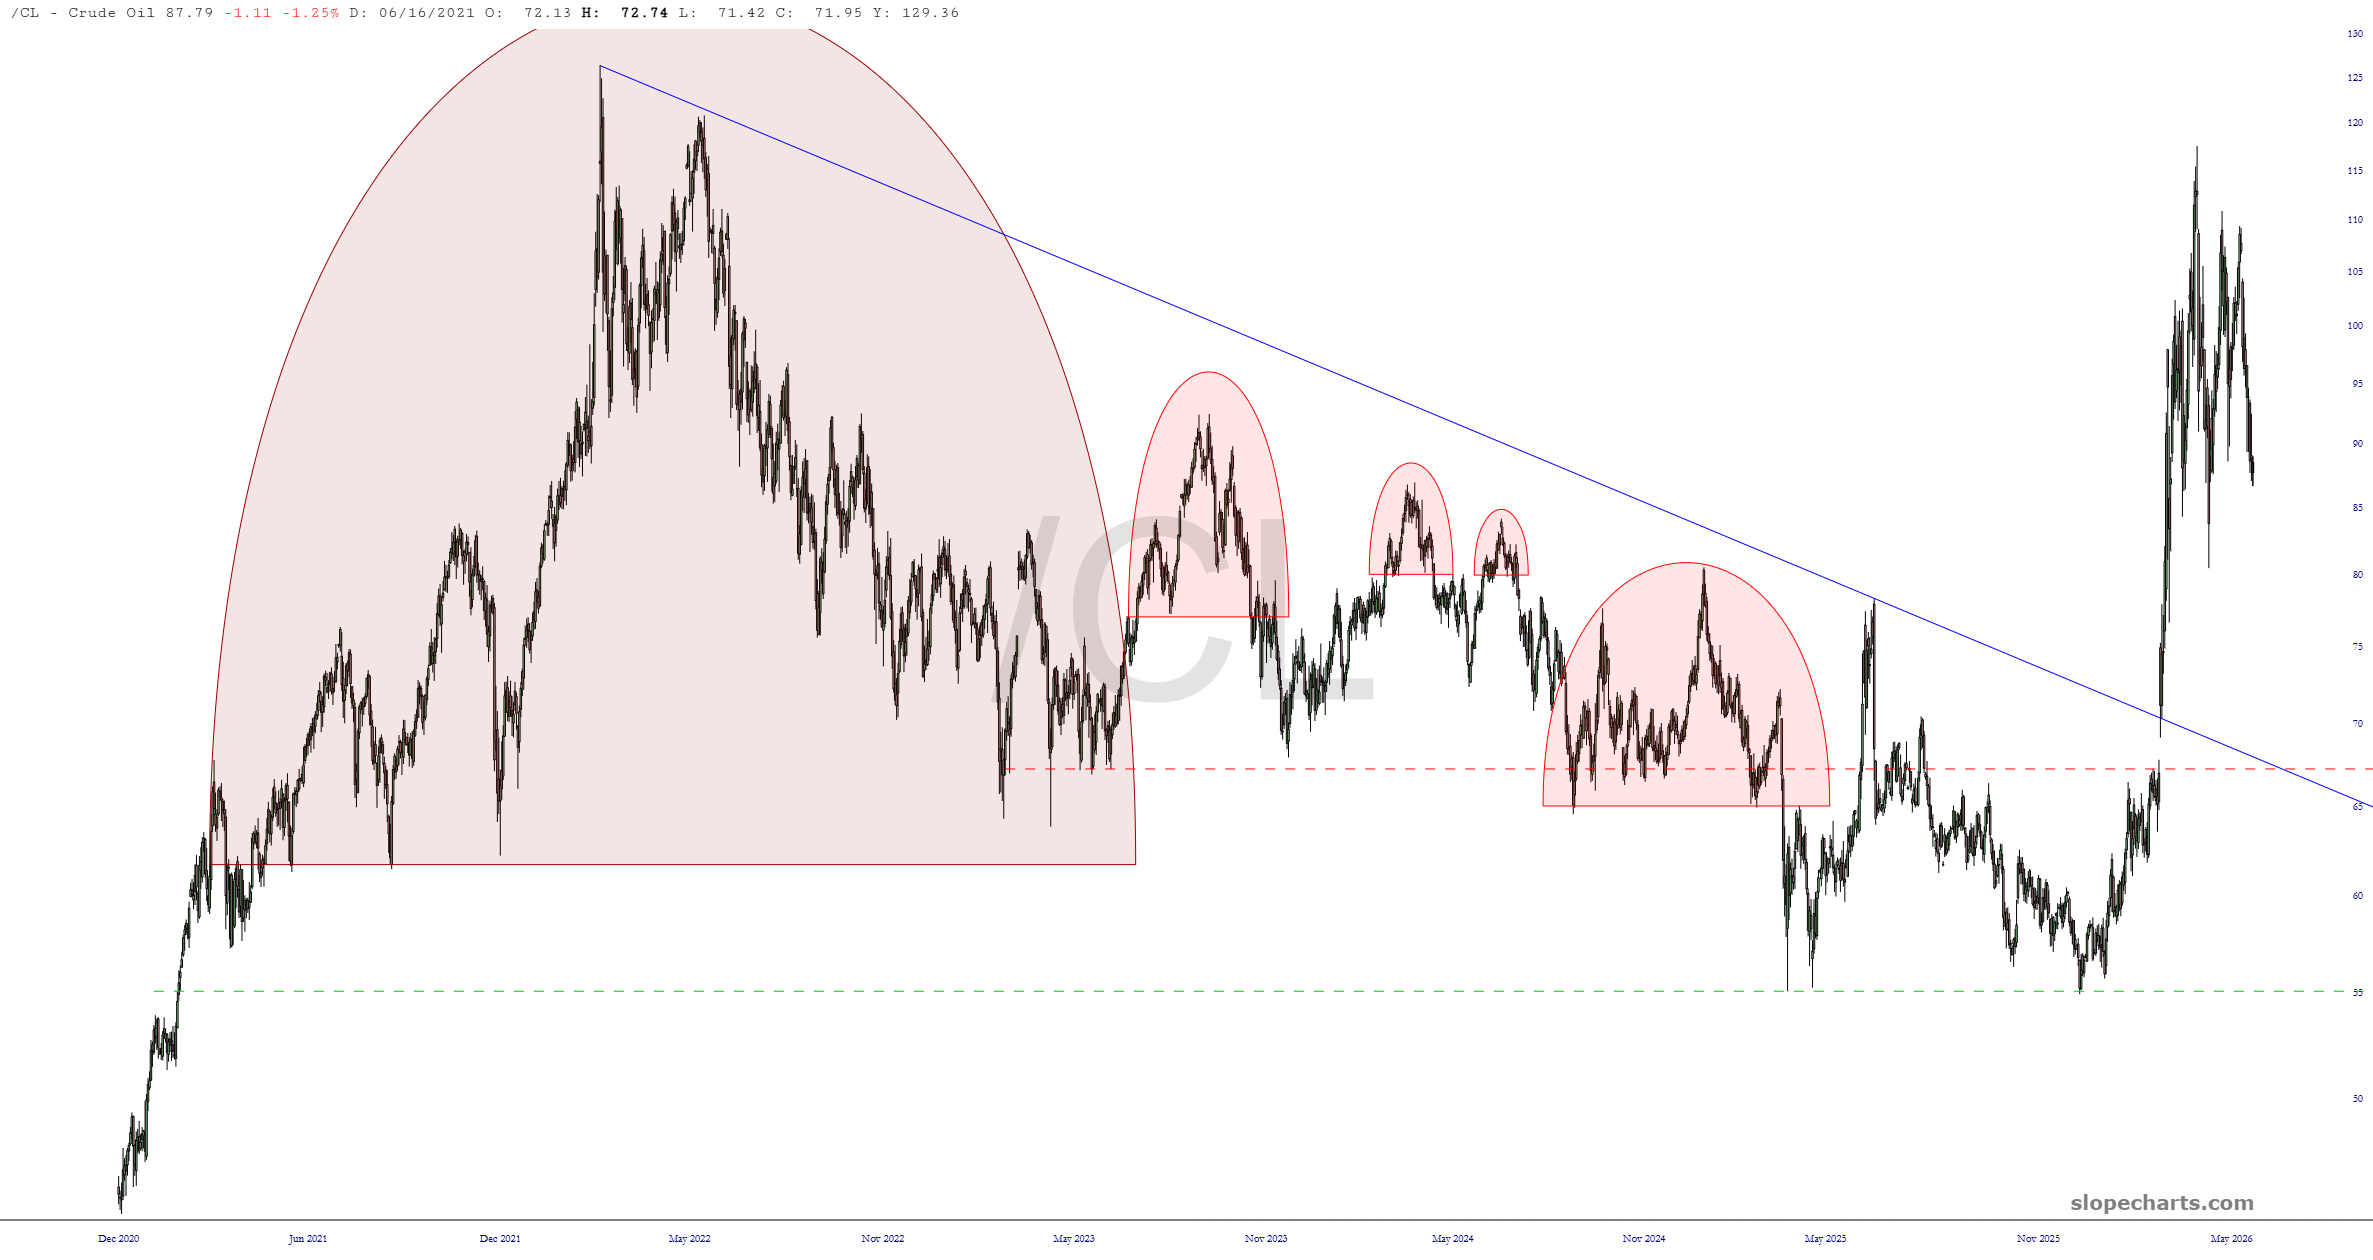
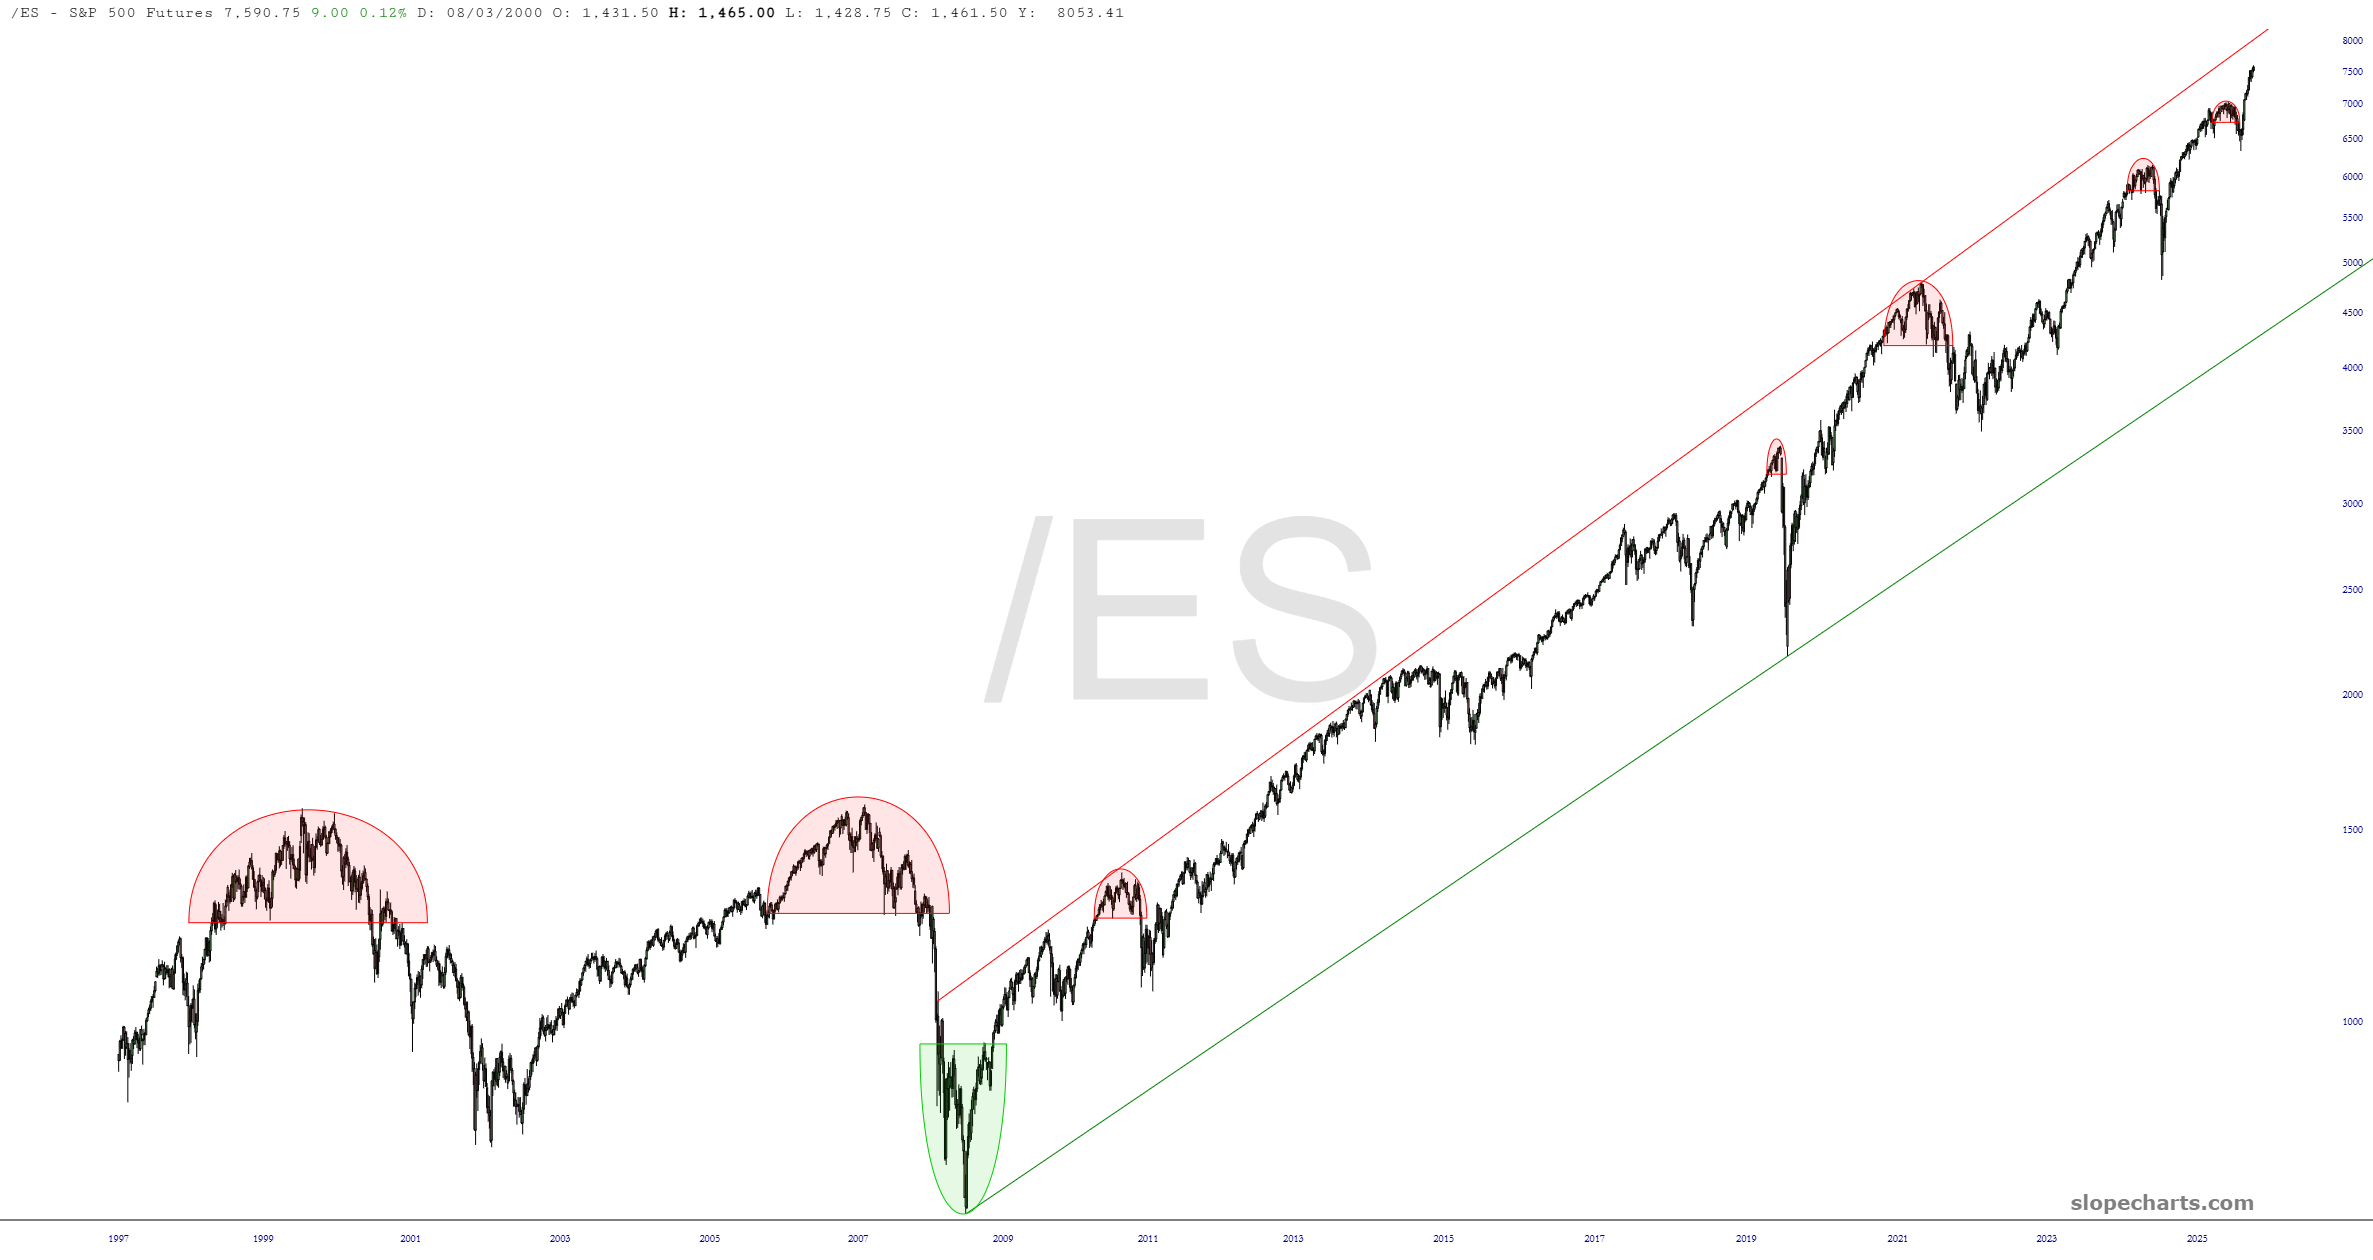
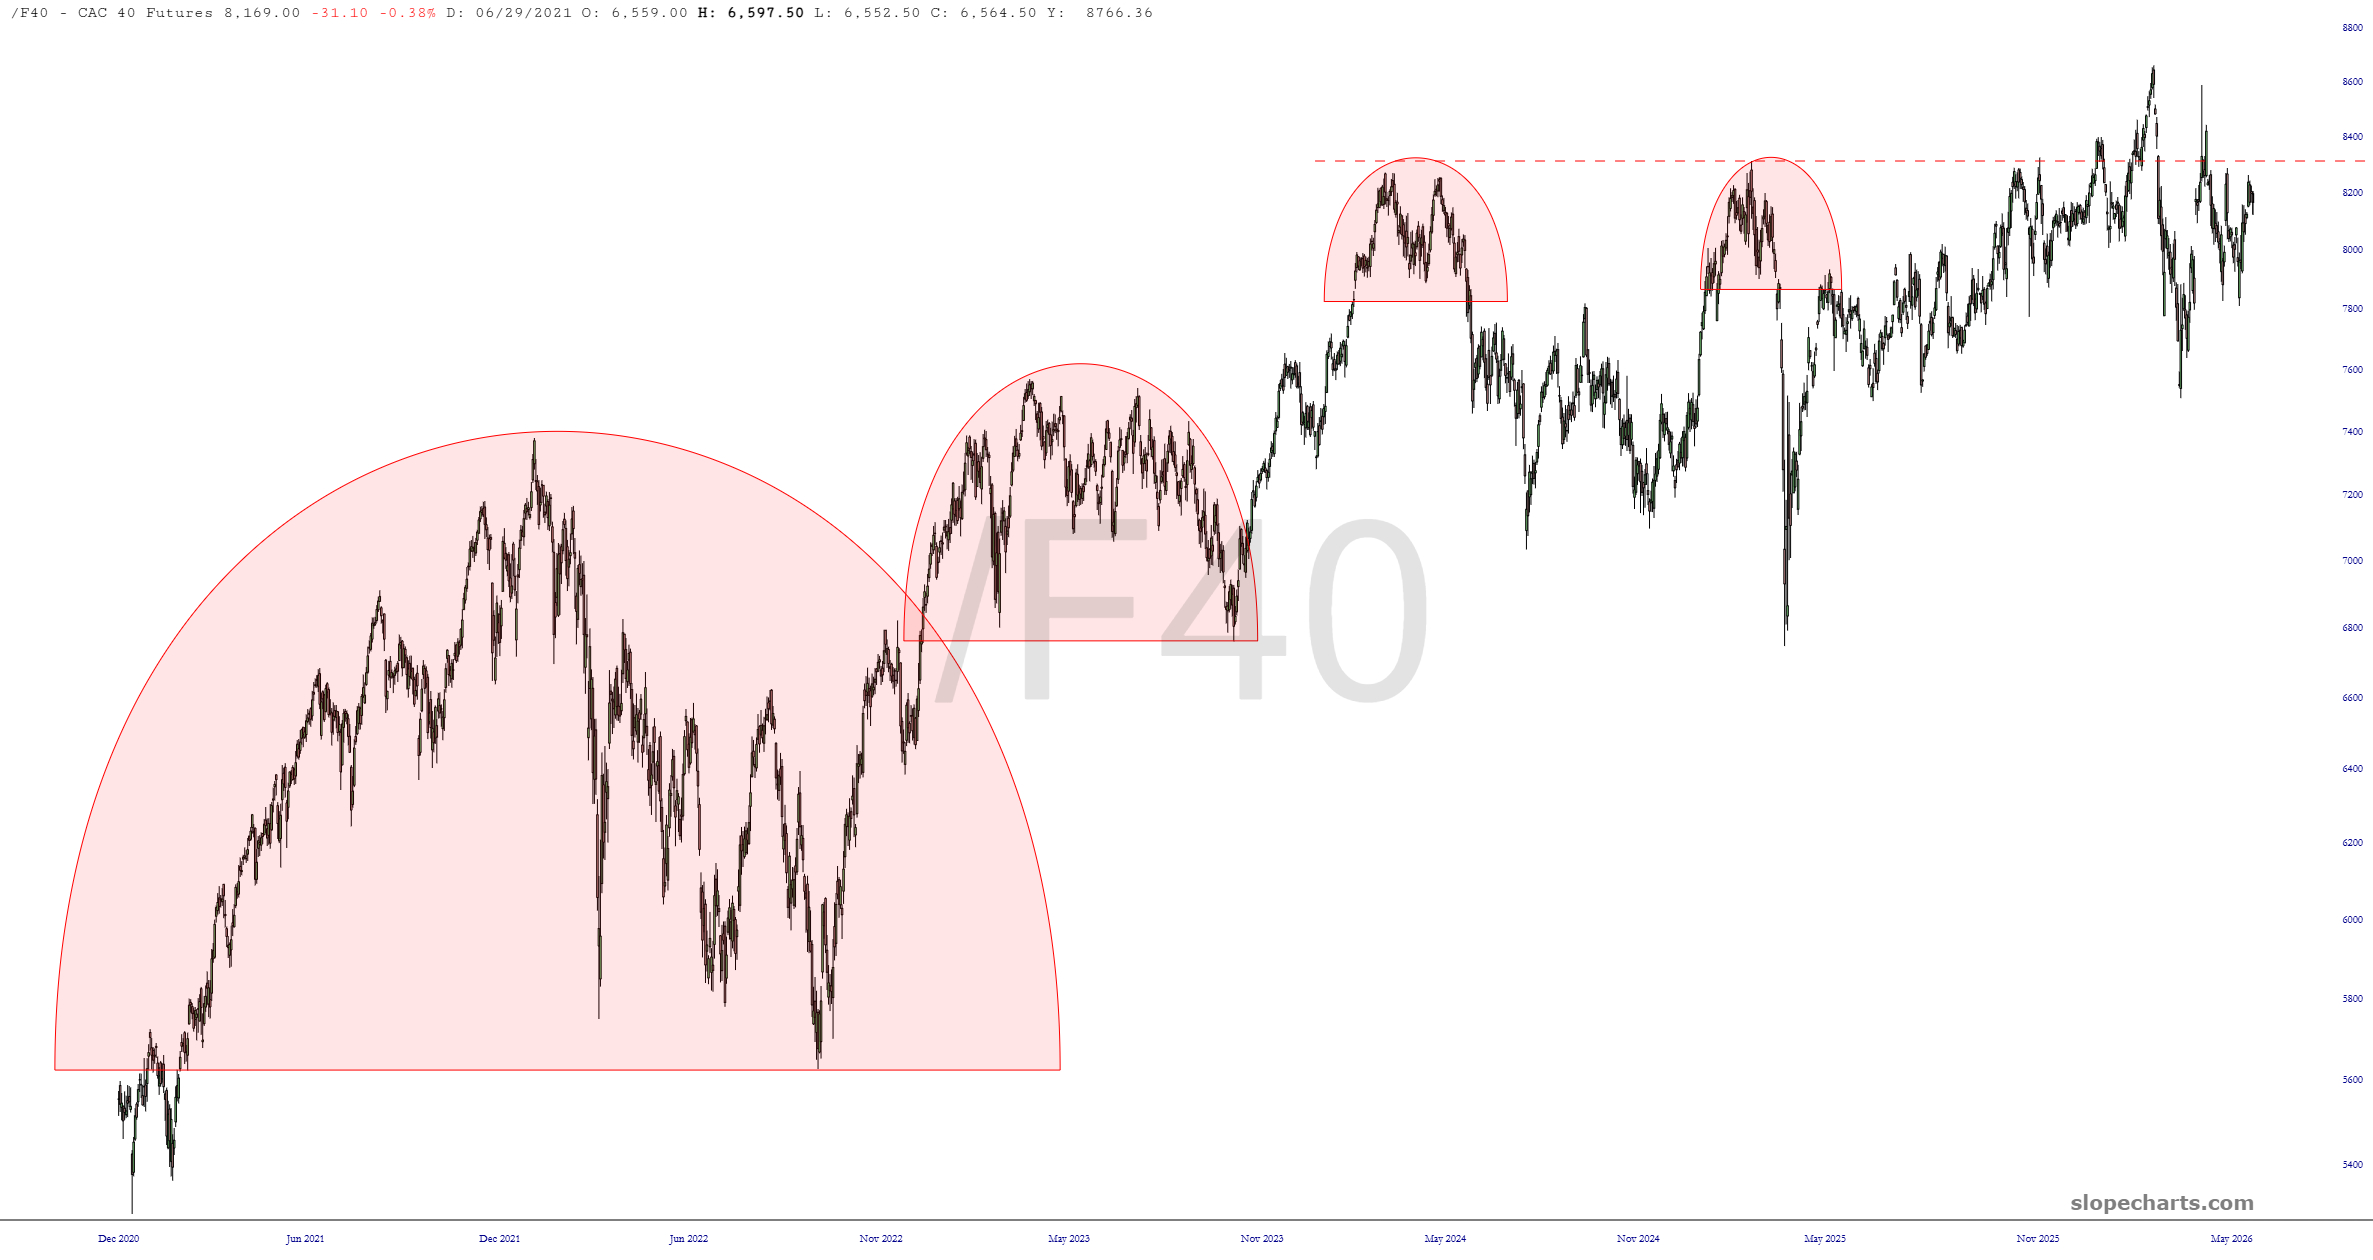
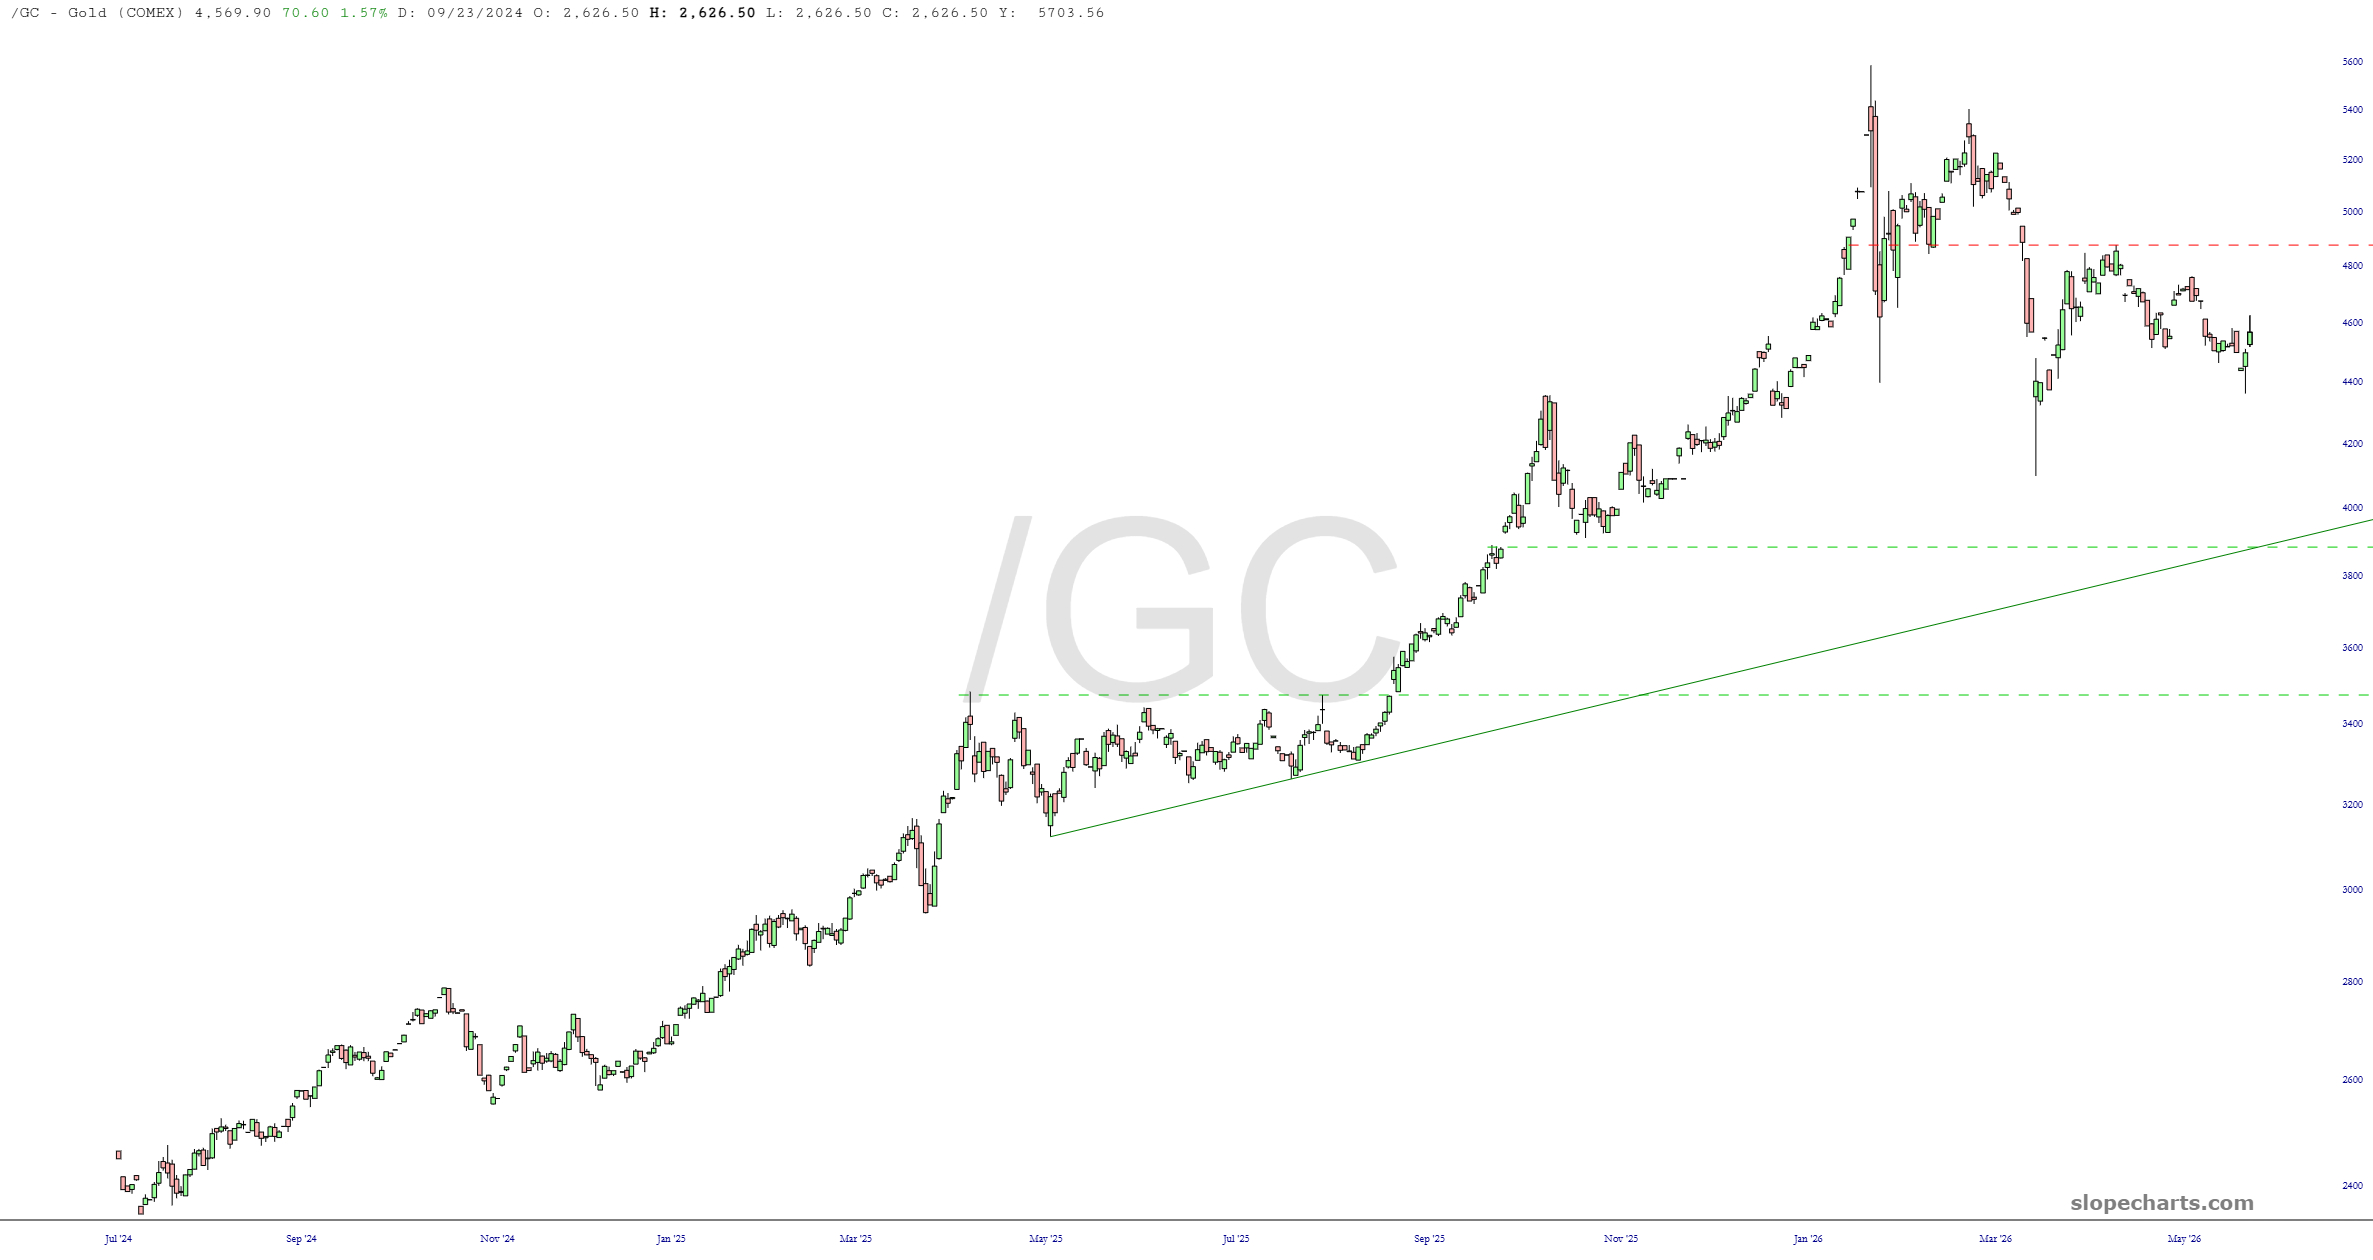
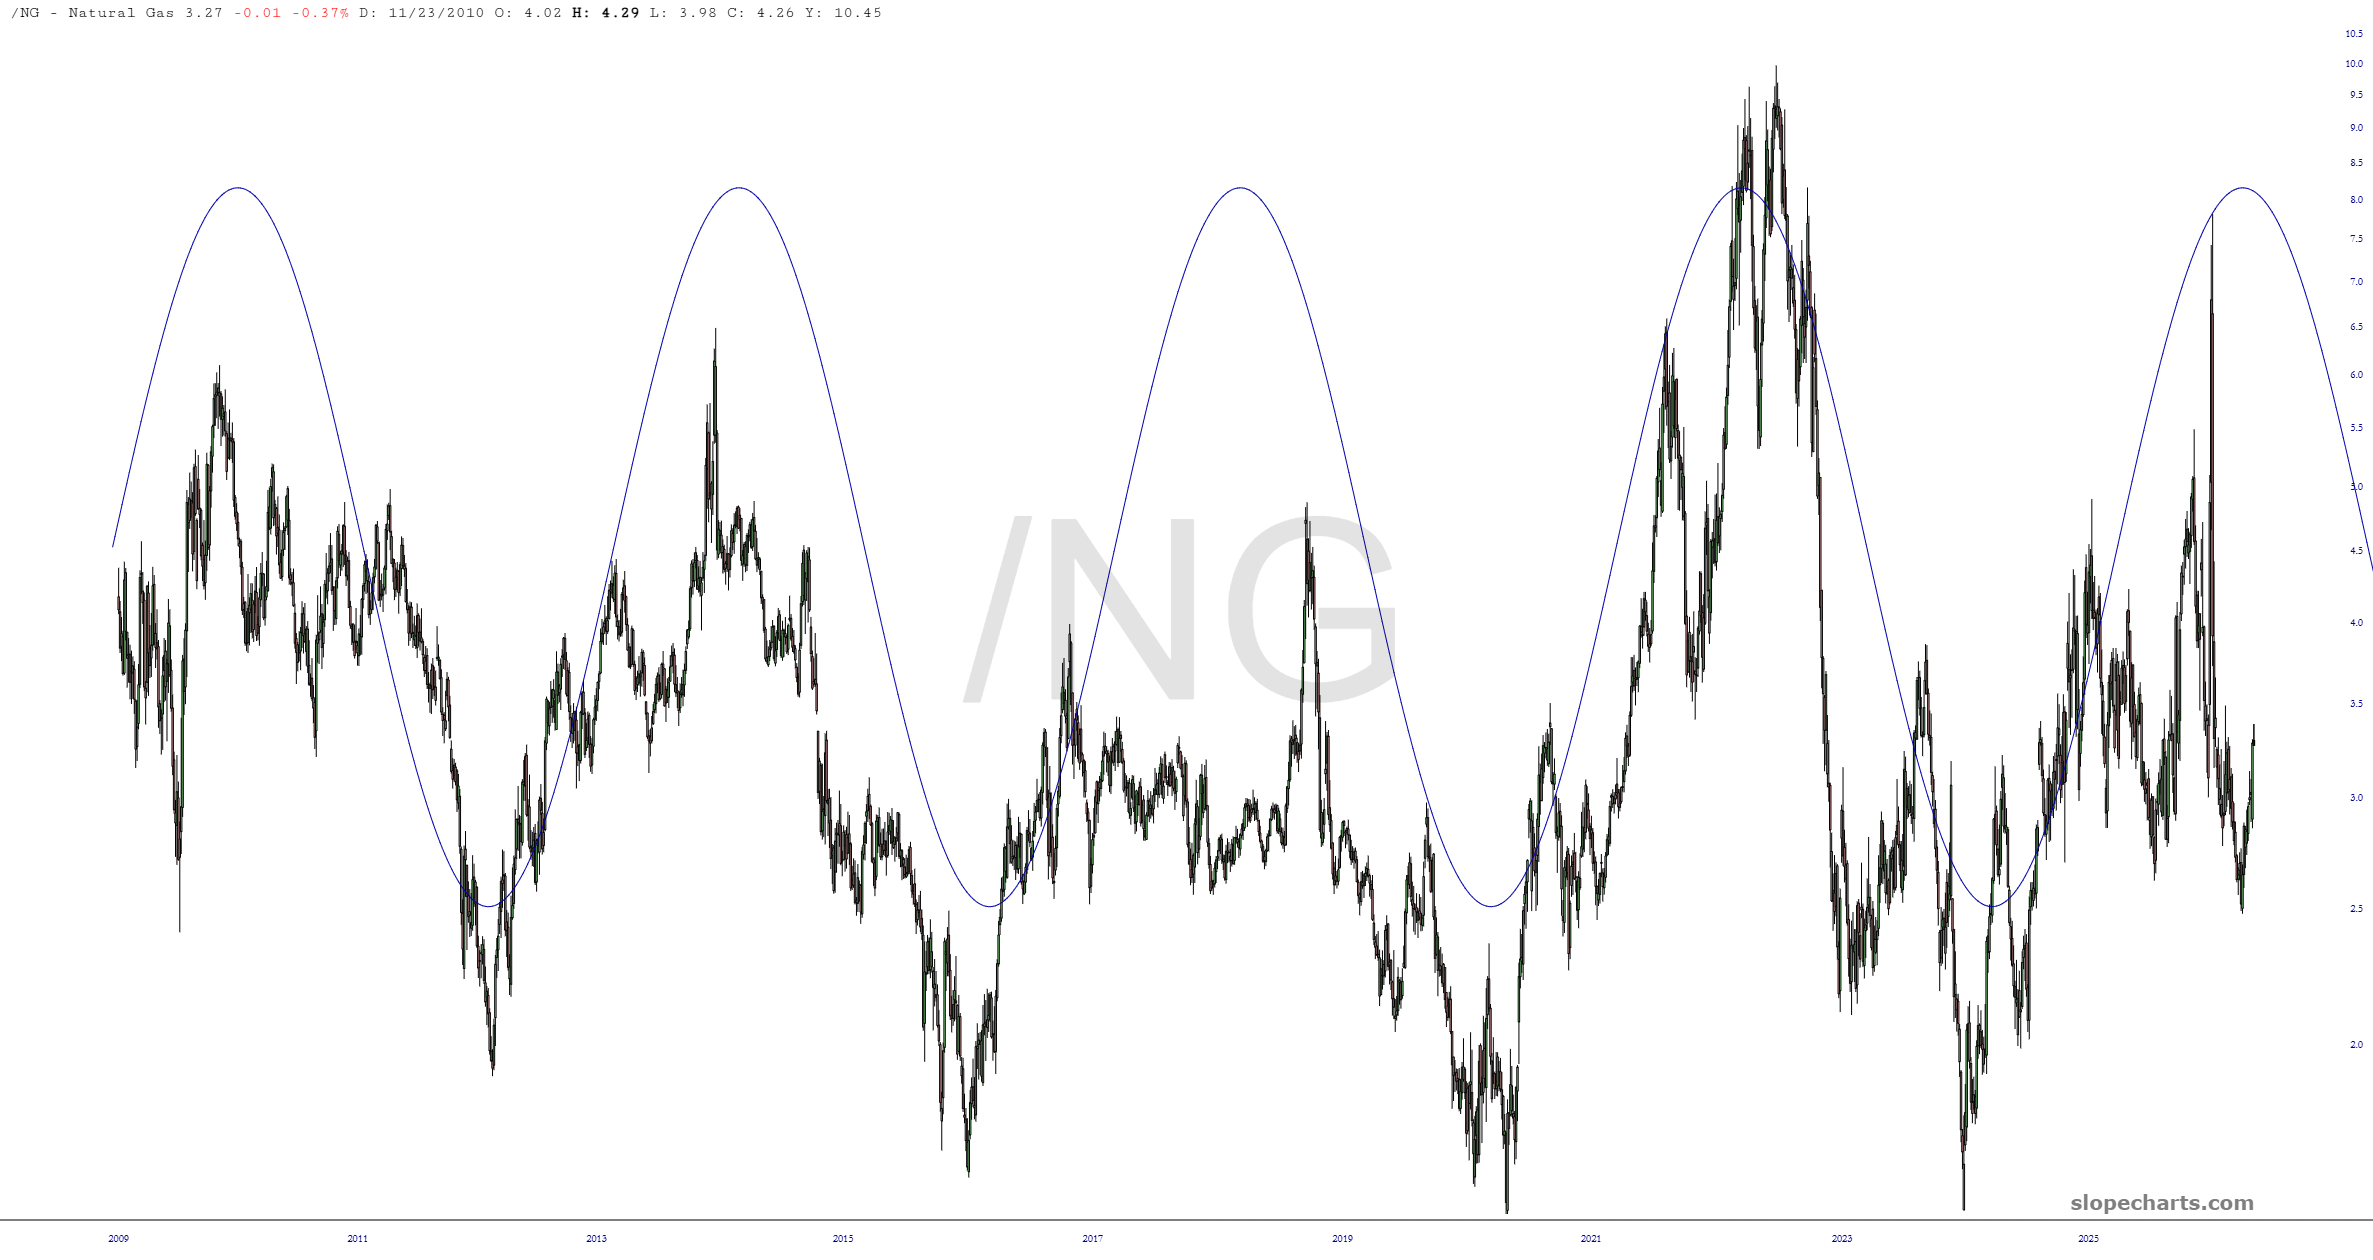
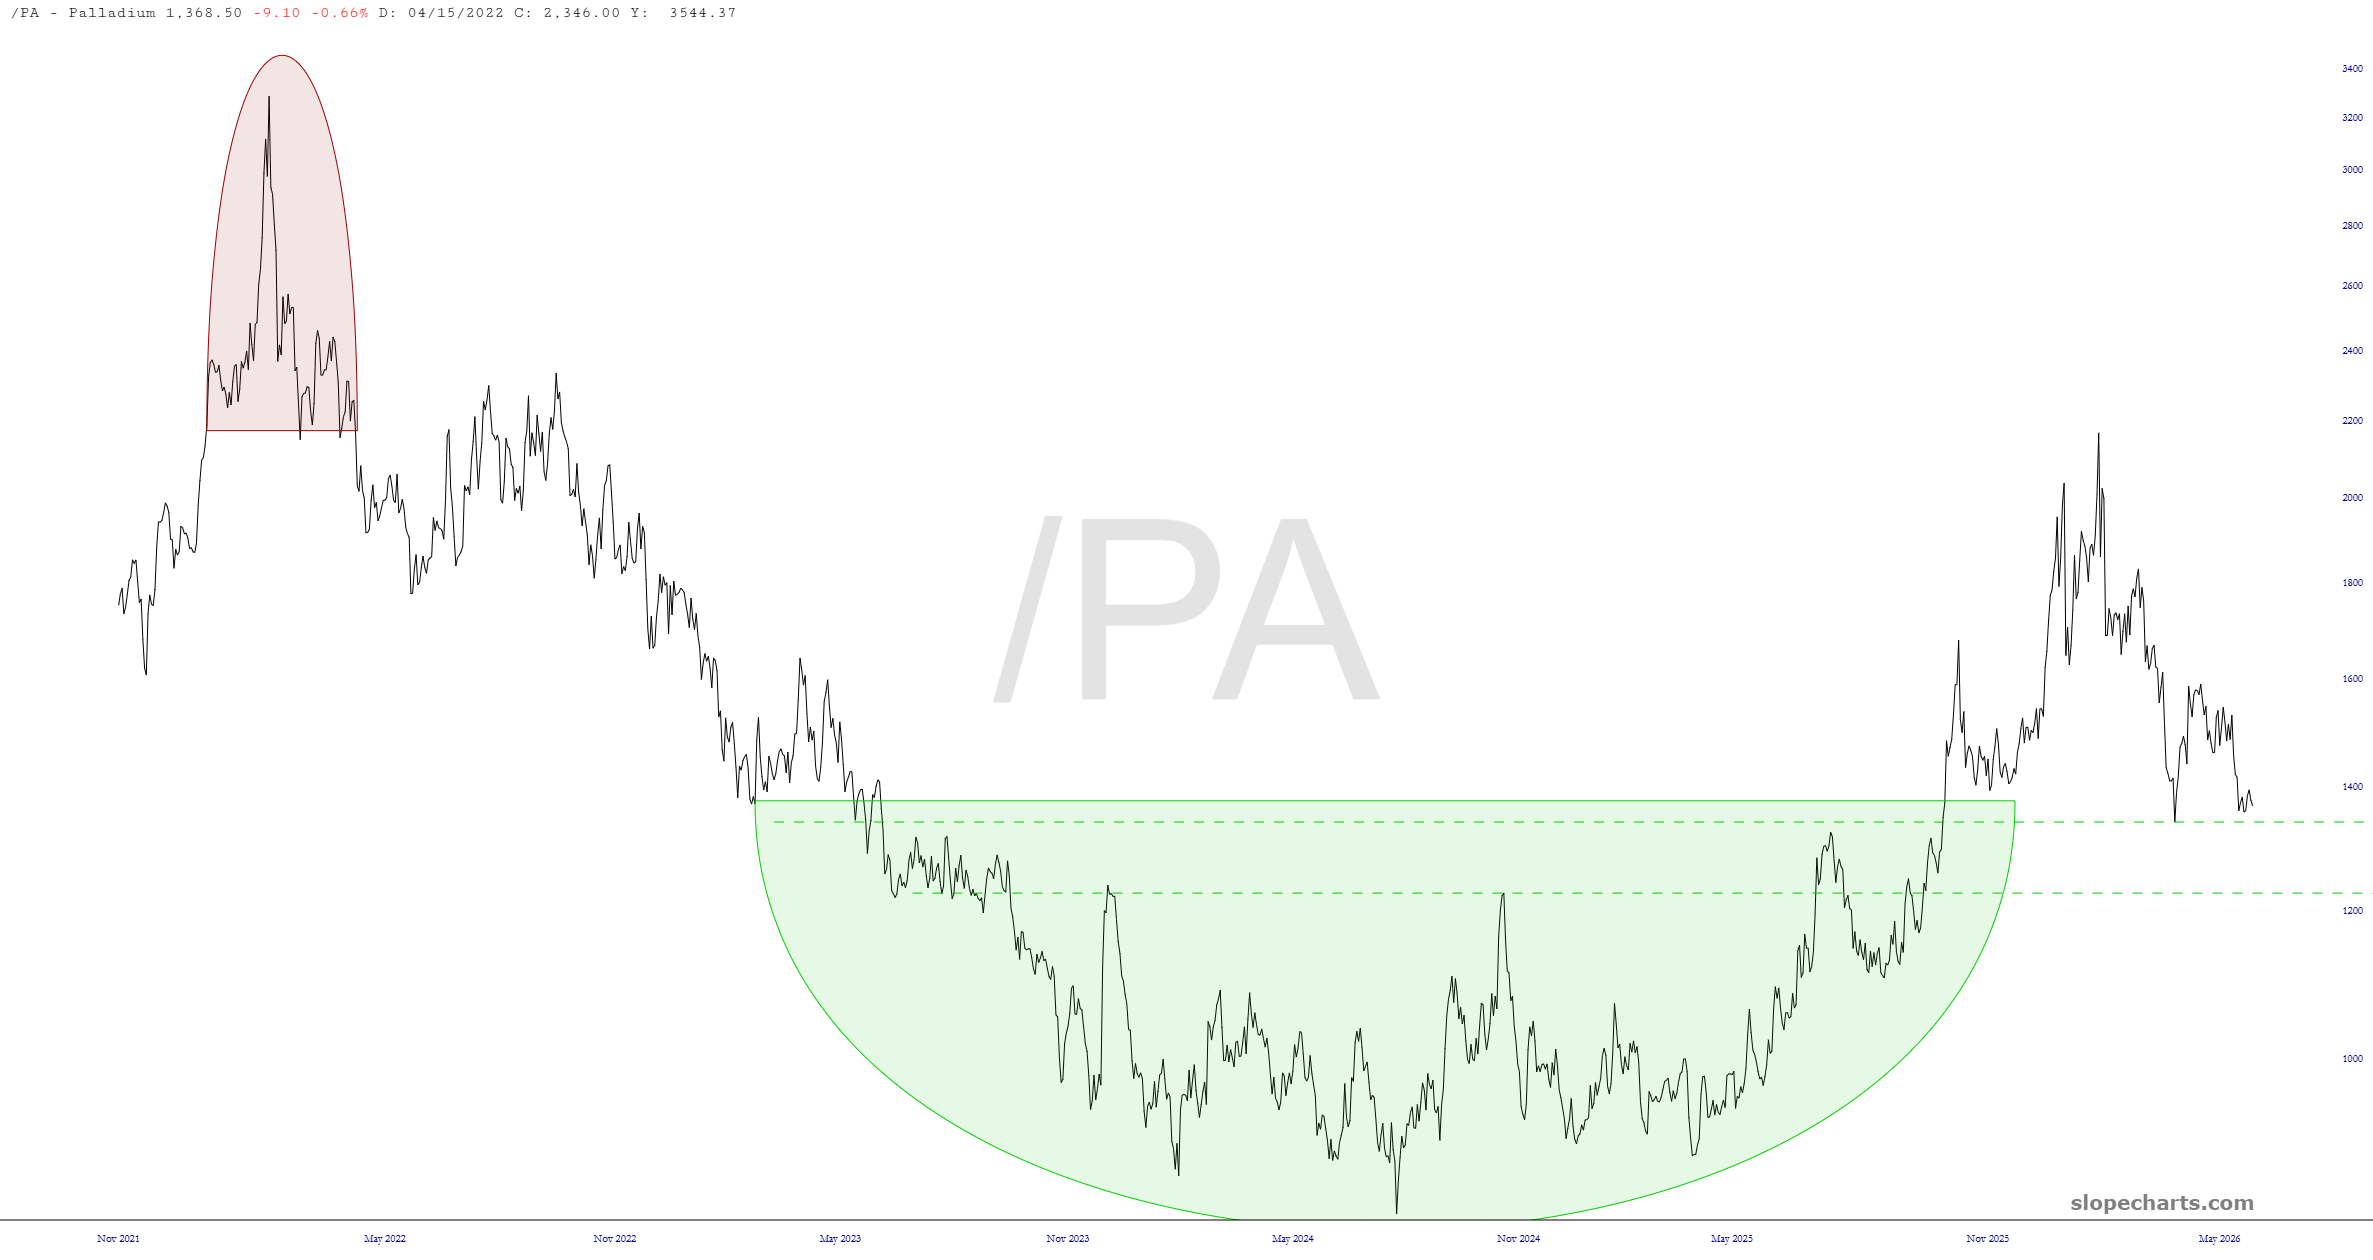
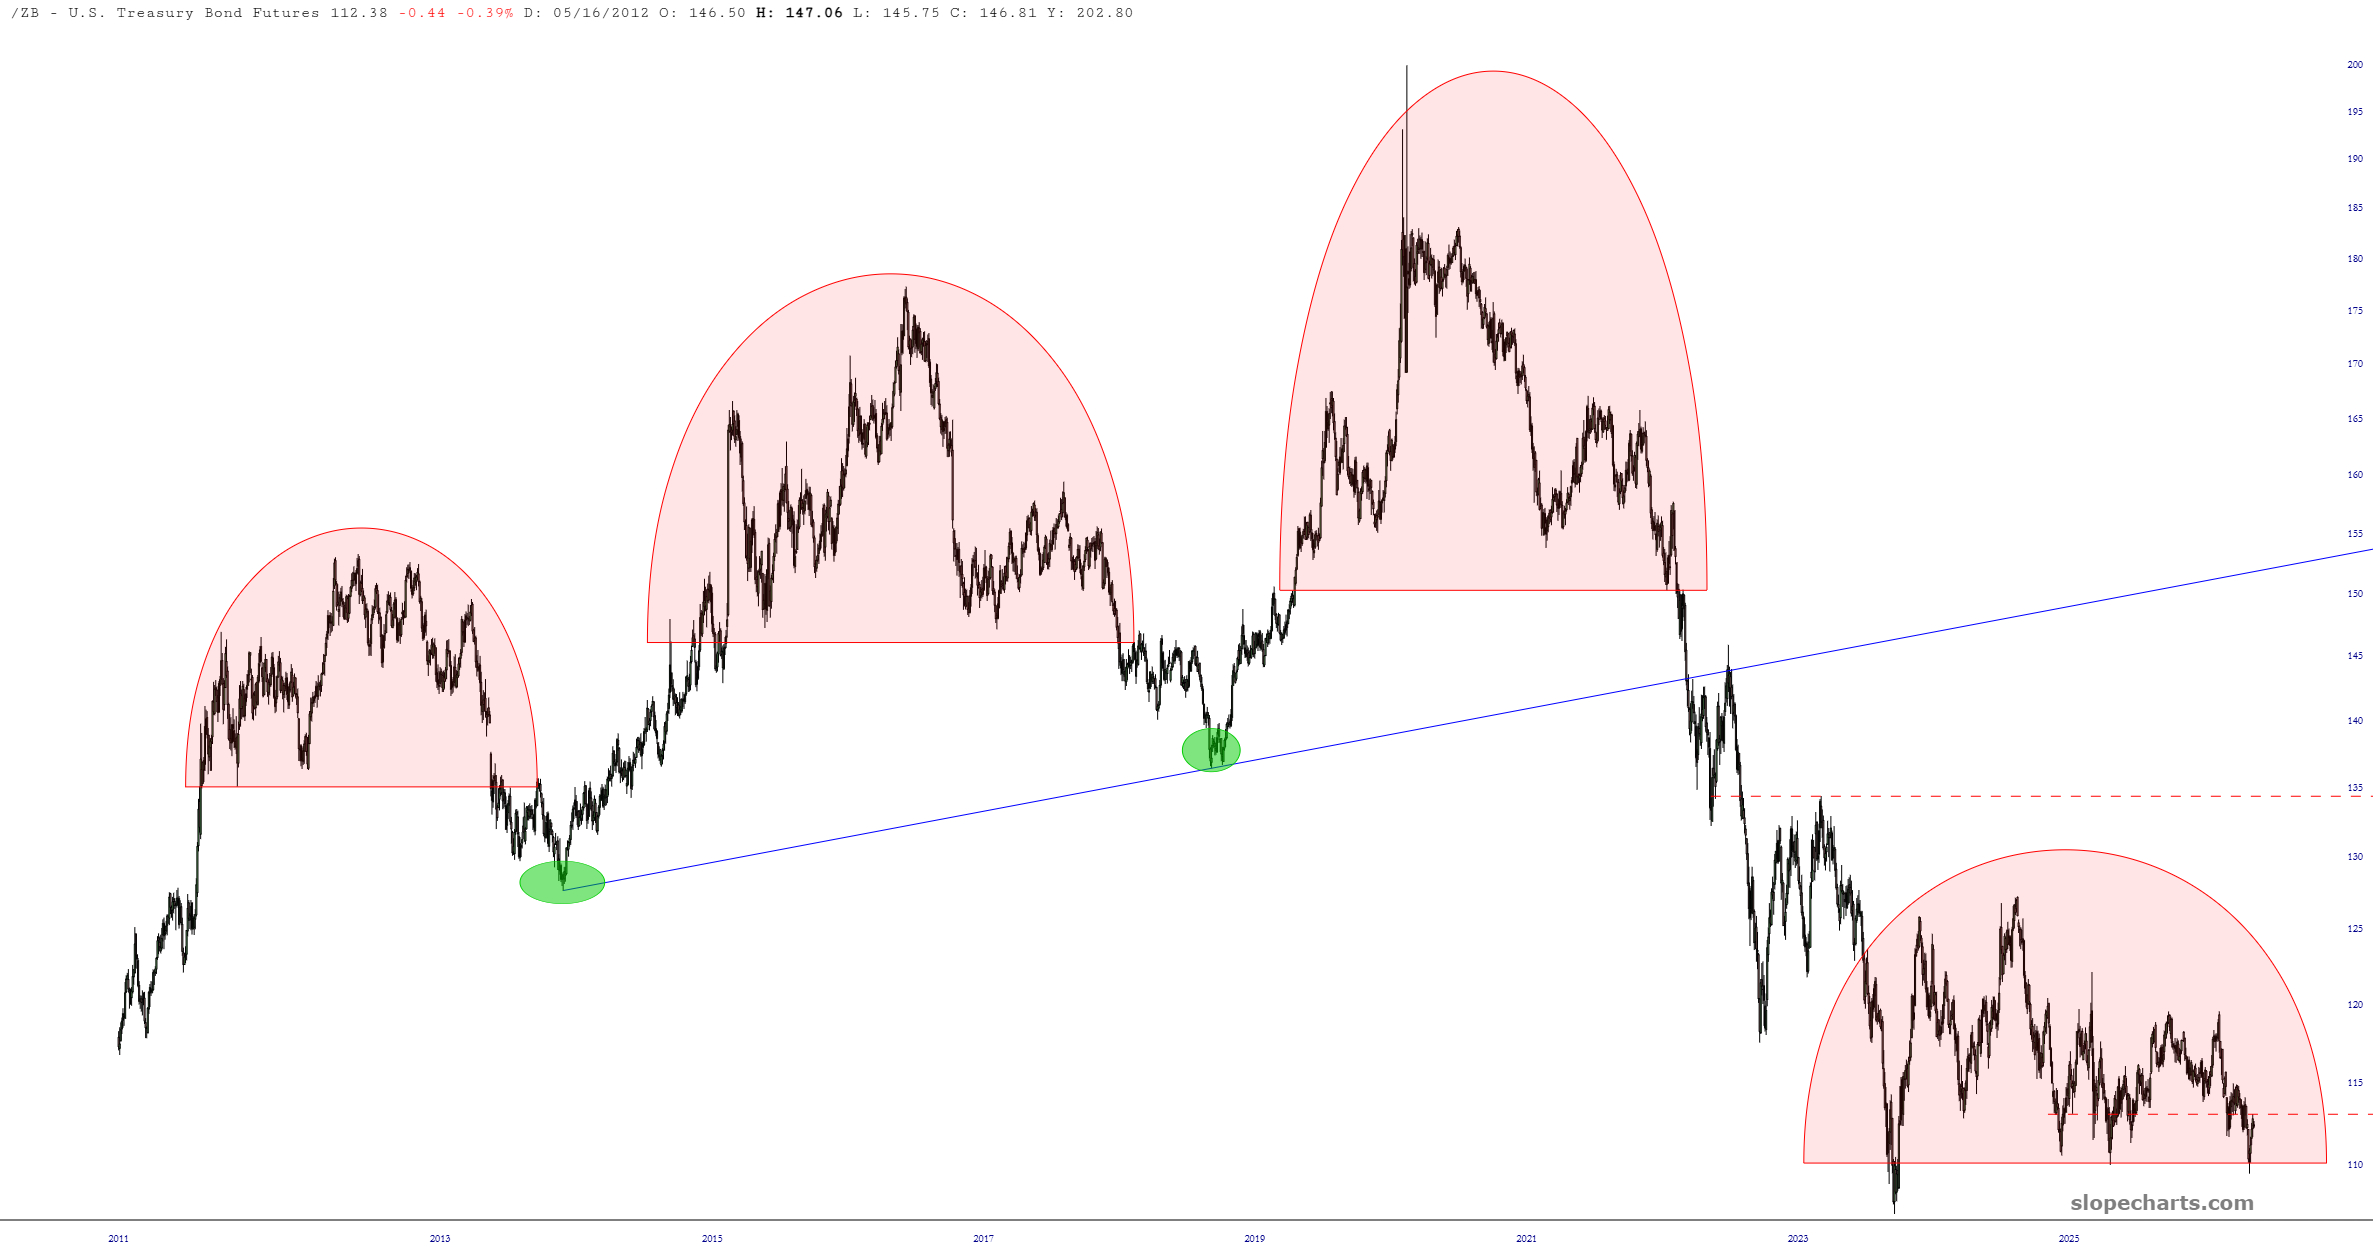
Our dear friend Bitcoin is sporting a massive topping pattern and appears ready to fall hardOil’s explosive move was all around Iran, of course, and in spite of the war becoming largely irrelevant, the lion’s share of the price increase is still intact. At most, the price would diminish back down to its price gap, which is the horizontal.The S&P 500 continuous futures contract has been in an ascending channel for years and is exceptionally close to its multi-year resistance trendline.The French CAC-40 seems much more vulnerable to a fall, since its recent breakout failed.Gold had a stunning rally for years, but that peaked out late in January. It could easily get down to $4,000 if not even weaker, all the way back down to its trendline.The natural gas cycle has continued to be reliable, and this remains the only chart I follow that actually has followed a regular sinewave.Palladium has been beaten down to the top of its basing pattern. If this support continues to hold, this could be a superb place to go long the metal. If the horizontal is broken, the price is vulnerable down to the next horizontal down.Bonds, finally, have the potential to break below its fourth and most recent reversal pattern.