
SPX traded sideways yesterday and is close to testing the recent highs in the pre-market. This isn't encouraging for the chances that the candidate double-top on ES and SPX will play out today, but it's worth noting that the daily upper bollinger band is now at 1528, so there is some decent resistance close above the recent highs:

On CL the short term low looks likely to be in, though I was expecting a more precise test of the 95 area support level. It may be that we will see that test after a bounce:

The bottoming setup on EURUSD is looking increasingly good. This may be a significant retracement low. On the chart I've divided the action on EURUSD over the last few weeks into two ranges, 1.33 to 1.35, and 1.35 to 1.37. The technical double bottom on EURUSD actually indicates a bit higher, but if EURUSD can break back over 1.35, I will be expecting a move back to test the current rally highs in the 1.37 area:

I'm still leaning towards SPX being in a lengthy interim topping process. Just to be clear I'm expecting more upside after that retracement however. The negative divergence on the daily RSI looks very promising and is supported by numerous other indices. After a request to look at these a few days ago, the ones I will show today are from Europe.
First the German Dax. The negative divergence on the daily RSI is even more marked on the Dax, and Dax has actually been retracing throughout February. Neither of the two obvious rising support trendlines have yet been hit and I'm expecting more downside:

Second the FTSE. This also has strongly negative RSI divergence on the daily chart and has seen a marginal higher high in February. A very nice looking double top is forming with a target in the 6030 area, though there is strong support on the way in the 6100 area at the 2012 highs. Again, more downside seems likely:

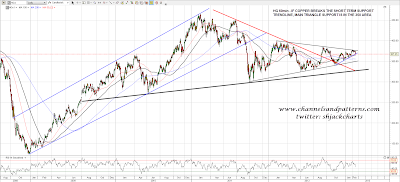
I've been posting the symmetrical triangle on copper futures once a week or so and have been wondering whether this might finally break upwards to support further rises on equities. It's reversed at triangle resistance instead however, and on a break of the short term support trendline the target is main triangle support in the 450 area:
If we are working from the usual seasonal script here, then we should see a potentially very sharp retracement sometime in the next four weeks, followed by a higher high in the late March to early May period, before a larger decline in the summer. The obvious place to see that first retracement is here, given also that Februarys tend to close flat or down. Will it actually happen? Hard to say, but with significant daily negative RSI divergence more or less across the board on US and international equity indices, including on the US leaders TRAN and RUT, this is a risky area to be long short term.
