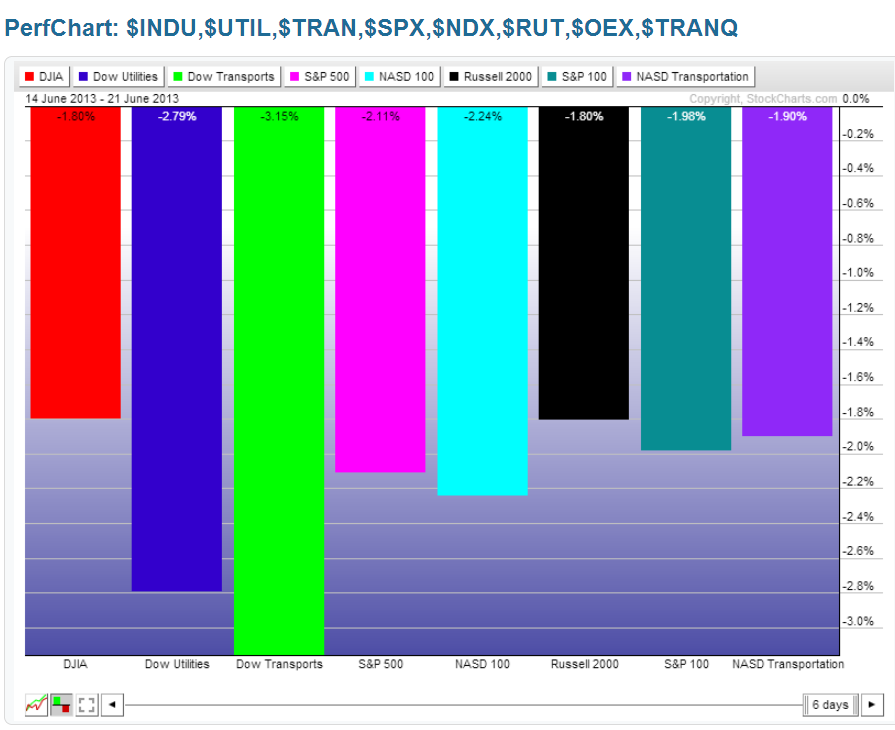
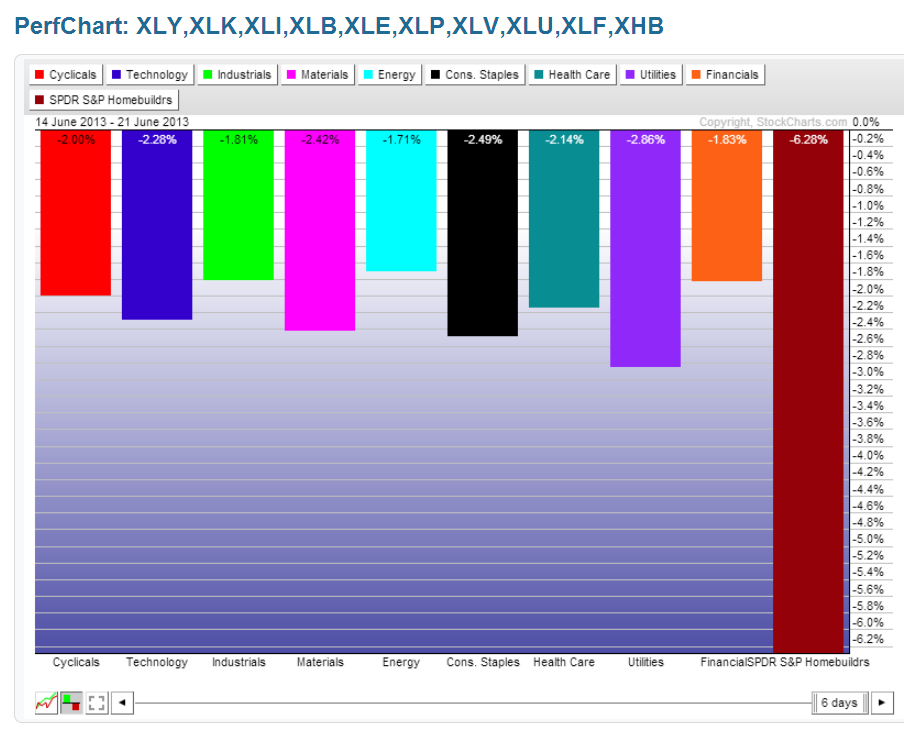
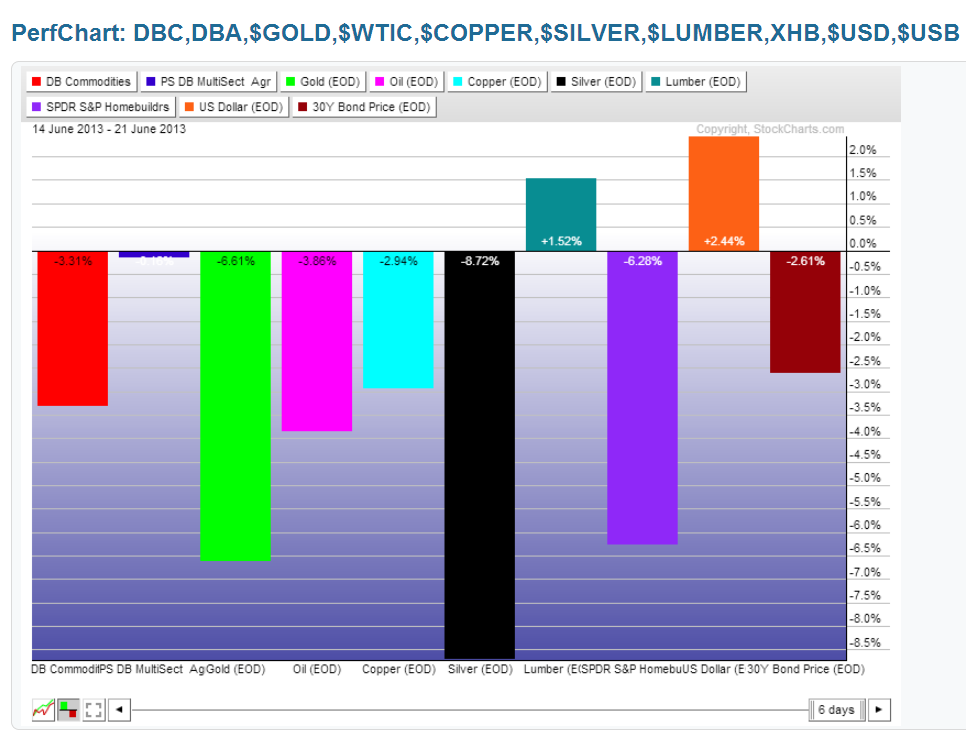
Further to my last Weekly Market Update, this week’s update will simply show percentage gained/lost graphs of World Market action for the week.
You can see that, with the exception of Japan’s Nikkei, the U.S. $, and Lumber, they all declined. What I like about this graph format is the fact that we can see, at a glance, where money flow has been directed this past week in various world markets, and to see the “outliers”…that is, which markets gained or lost the most amount compared to the others…ones to watch going forward to see if they continue leading in strength or weakness and what effect they may have on other instruments (e.g., Greece, Japan, Homebuilders, Metals, the BRIC countries, the U.S. $, and Bonds), as well as the TNX:SPX ratio, as outlined in my post of June 17th.
Inasmuch as next week is full of economic data, is the end of the month, is the end of Q2 for 2013, will see nine FOMC members speak at various venues, and will see Fed POMO activity on all five days, I wouldn’t be surprised to see intraday and overnight volatility increase as market participants attempt to interpret, what will likely be, conflicting information, data, and viewpoints, not to mention reaction to further domestic and foreign news at it unfolds. As such, we could see choppy, non-directional trading with large, volatile swings dominating…it should be an “interesting” week.


Have a great weekend (enjoy the first day of Summer) and good luck next week!