
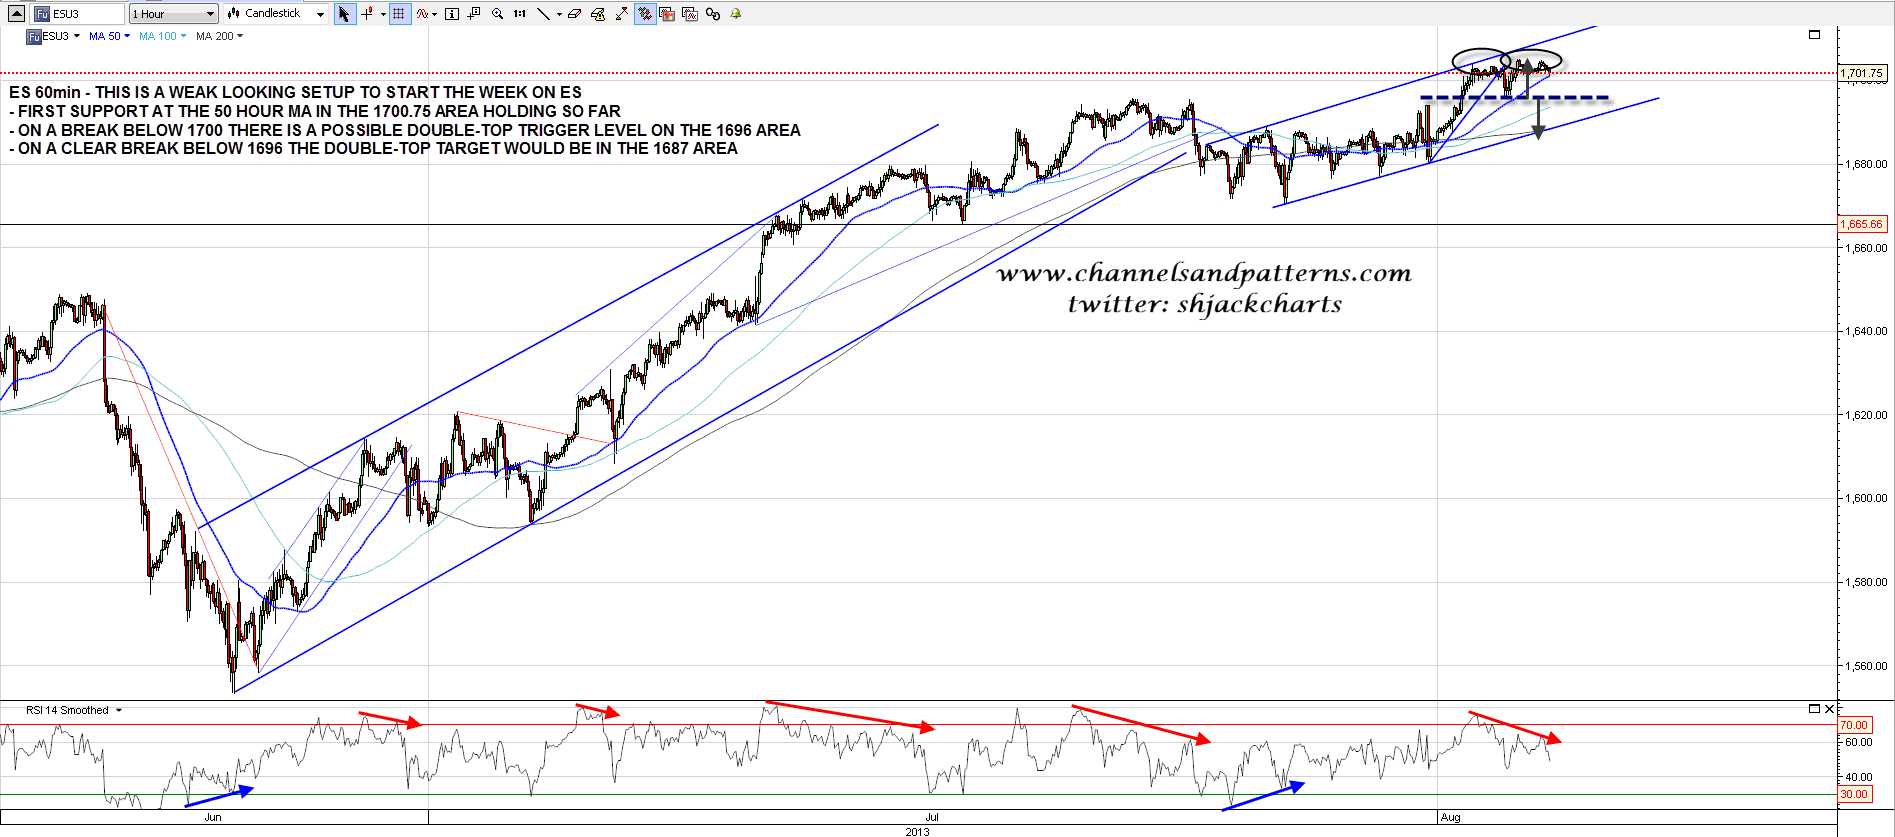
There’s a weak looking setup on ES coming into this week. There is some negative divergence on the 60min RSI, a possible rising channel from the last low with channel support currently in the 1688 area, and ES is testing the 50 hour MA in the 1700.75 area to see whether it will hold as support. As long as it does then bulls have the edge, but if ES breaks below the 50 HMA ten there is a possible short term double-top trigger level at 1696, and a target in the 1687 area on a break below that. I don’t think a significant high is in yet so if we do see an early retrace I’ll be looking for a good long entry. ES 60min chart:
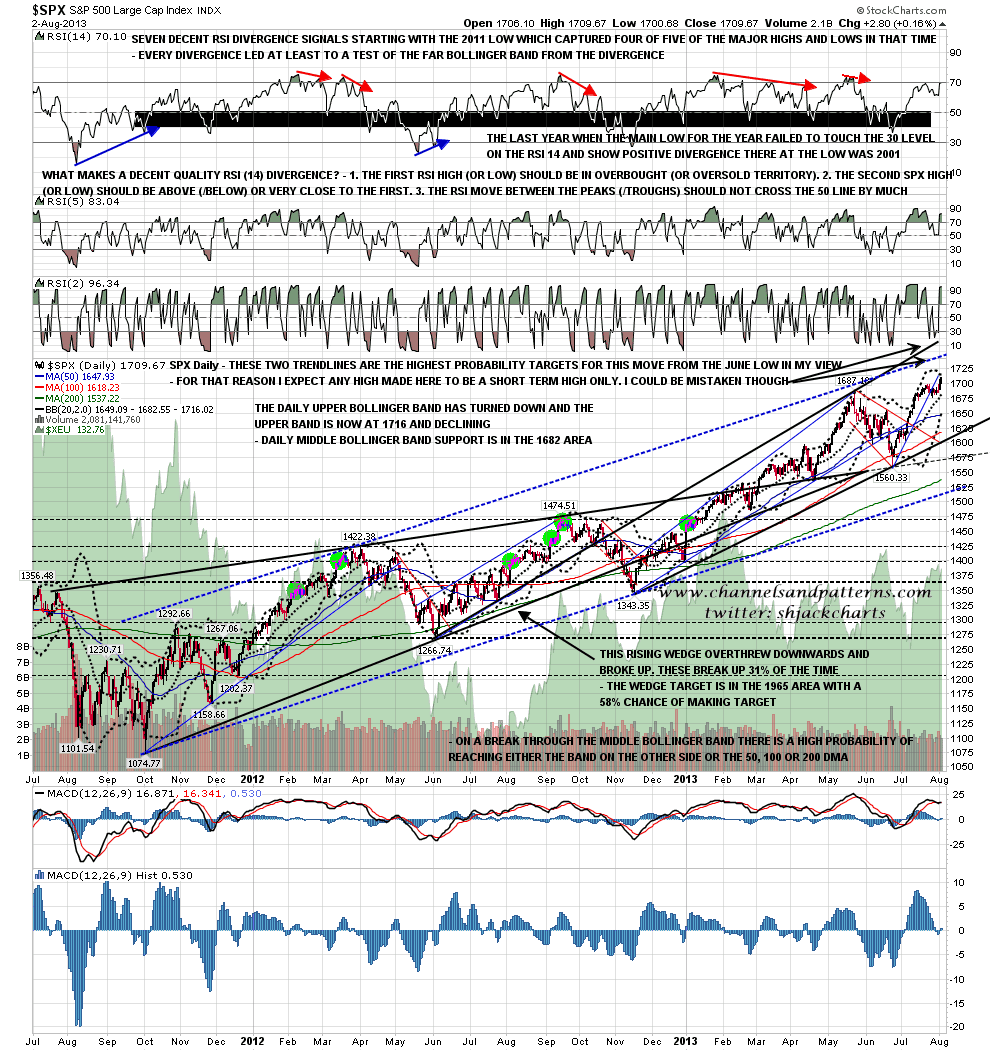
On the SPX daily chart the upper bollinger band is turning down and is now at 1716. I’m not expecting a break above the daily upper bollinger band here so that should be fairly solid resistance on a daily closing basis. Daily middle bollinger band support is now in the 1682 area. SPX daily chart:
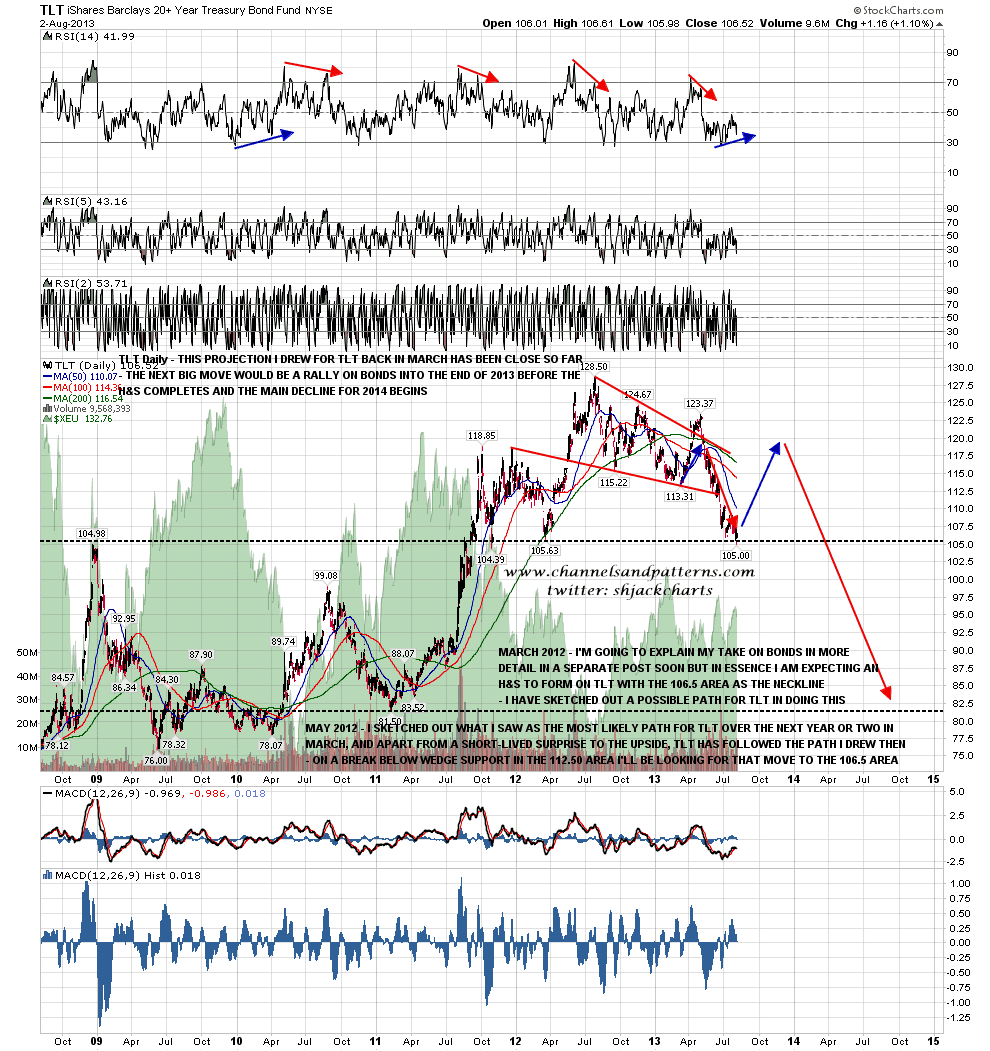
I have been watching bonds very carefully in recent weeks as I have been watching for a possible strong rally to start in this area in line with the TLT forecast I posted in March. That’s been a good performer so far but bonds are now at a significant inflection point and the rally I’m looking for may yet not happen. TLT daily chart:
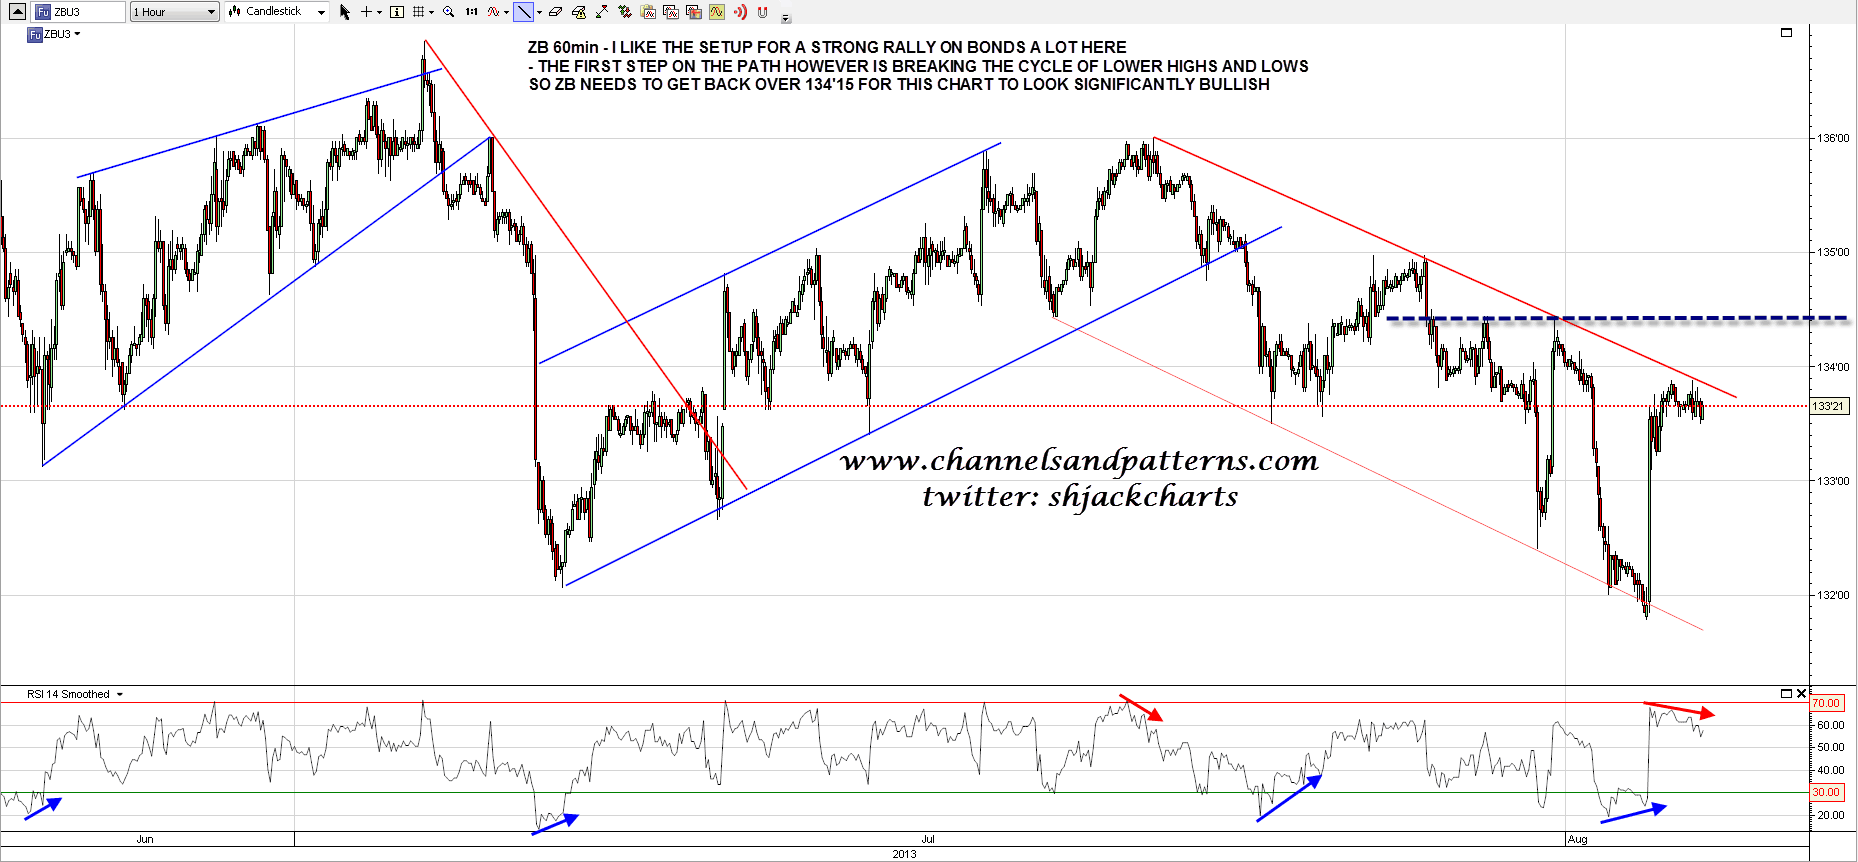
What am I particularly looking for on bonds here to show that a strong rally is starting? Well the TLT 60min chart looks promising, but to confirm that I’m looking for ZB (30yr treasury futures) to break the current short term series of lower highs and lows. If we are to see that soon then ZB needs to recover back over 134’15. If not then the overnight high was where I would have expected to see the next reversal to new lows, and so far ZB is reversing strongly there. ZB 60min chart:
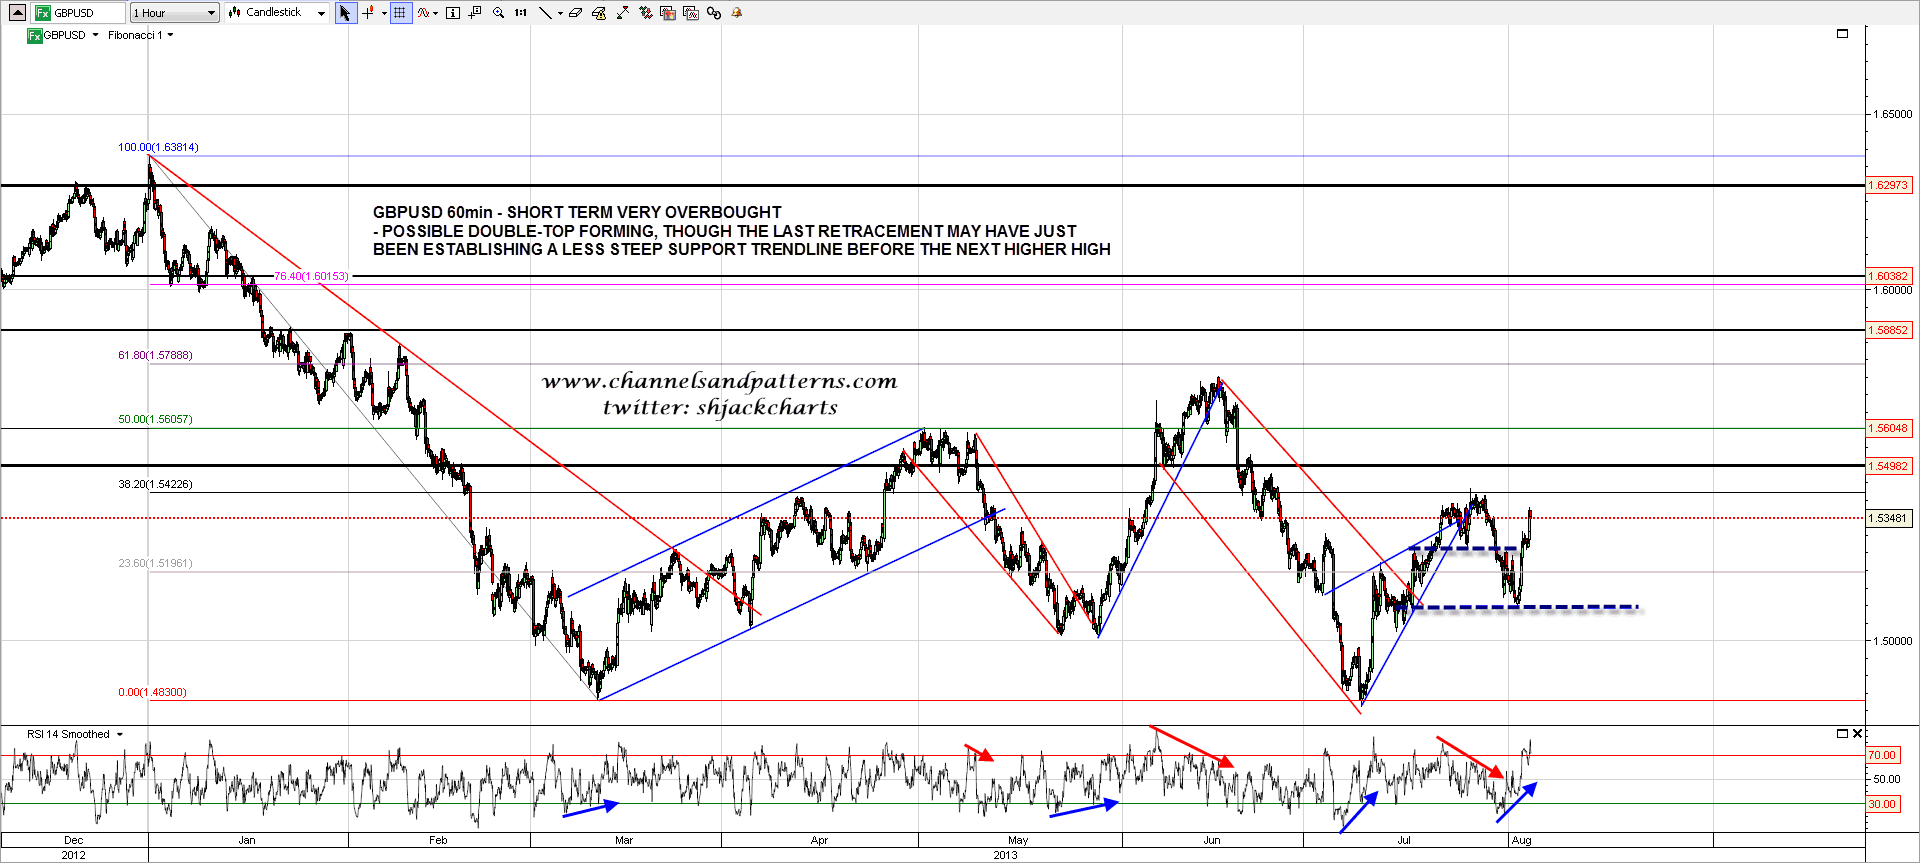
I’m still watching GBPUSD as a decent inverse proxy for USD, and there was a very strong retracement there last week. Most of that has now been reversed and there is a possible double-top forming there, but equally GBPUSD may have just been establishing a more sustainable support trendline before making the next higher high. No clear direction on GBPUSD here though short term it is very overbought on the 60min chart. GBPUSD 60min chart:
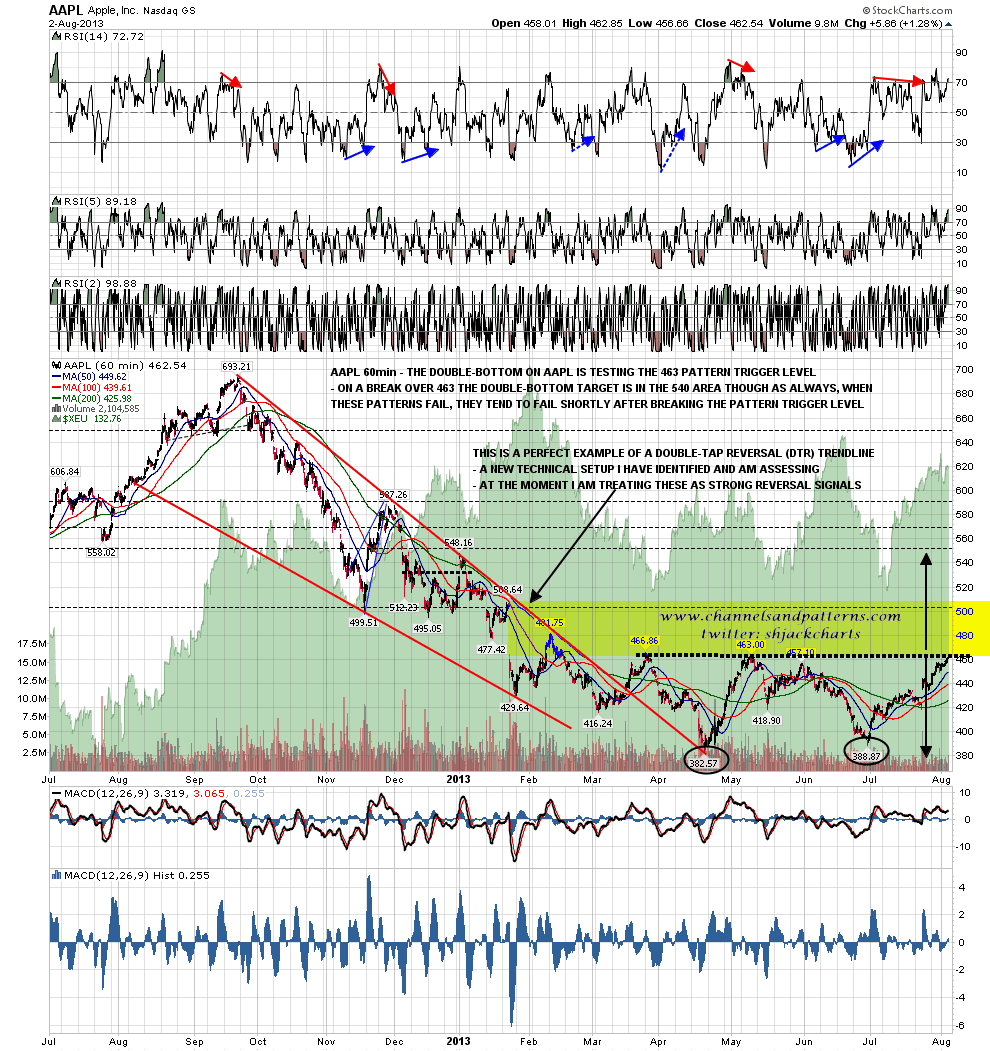
The reversal setup on AAPL has been forming slowly since the falling wedge from the high broke up in March. The moment of truth has now arrived with the trigger level on the nice looking double bottom now been tested. I’m expecting AAPL to break up and make the 540 area target, though as always with these setups I would caution that when these high probability patterns fail, it tends to be very shortly after the break above the trigger level. AAPL 60min chart:
I’m leaning cautiously bearish on ES today, though that will be cautious until we see an hourly close below 1700. If we see that I’ll be looking for a move to the 1687/8 area.
