Here we are on a Sunday, having introduced two new features! The first was our new Starred Comments feature, and now we are pleased to tell you of the newest indicator in SlopeCharts: the Zig Zag.
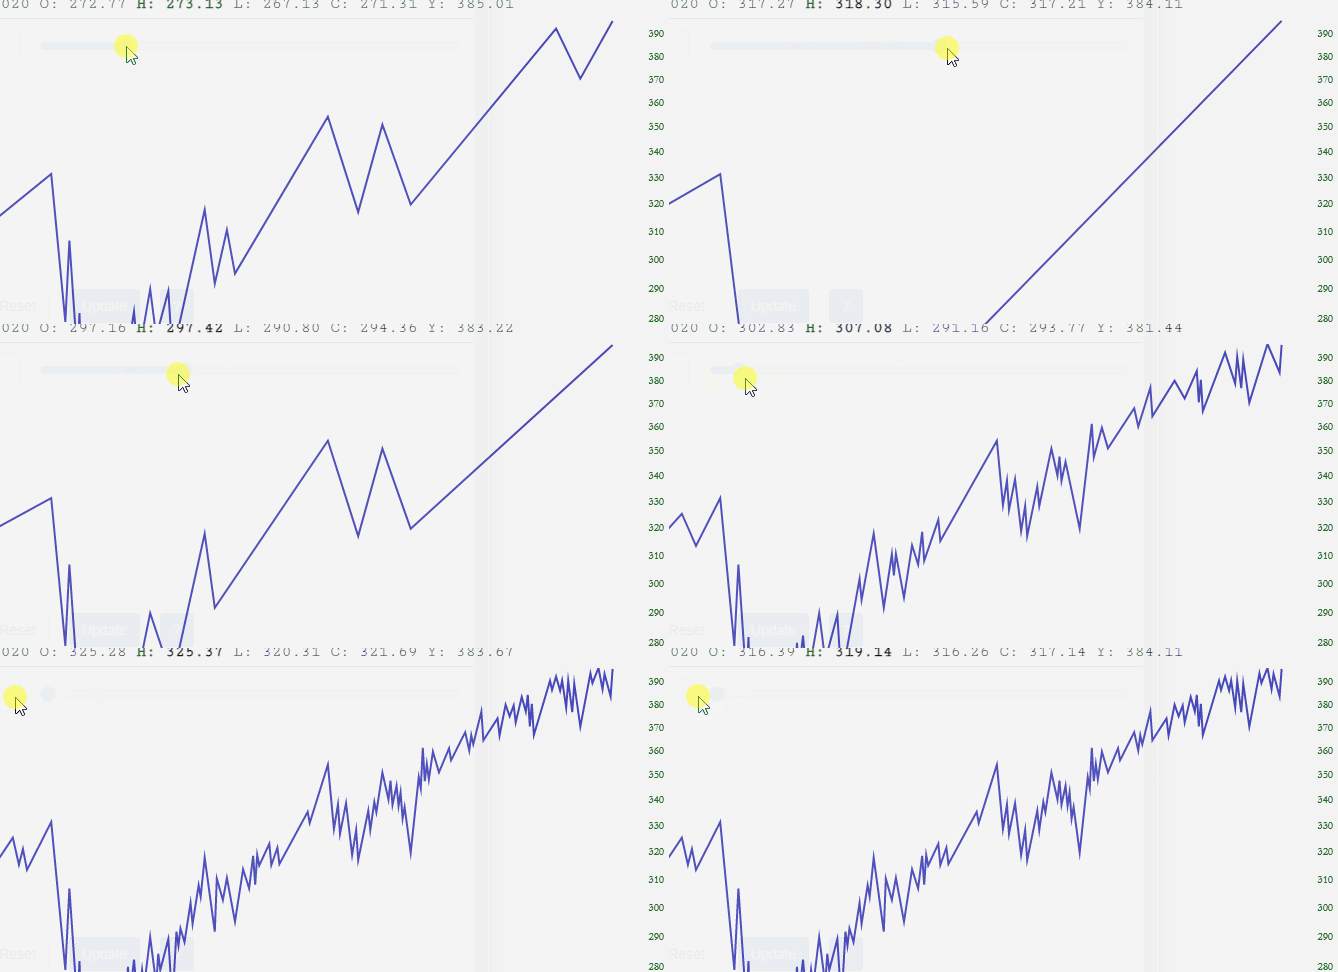
The Zig Zag indicator provides a quick and easy way of filtering out the “noise” of price data in order to create a simpler, easier-to-see perspective of long-term price action. You are in direct control as to how much “smoothing’ takes place. As with most SlopeCharts indicators, merely by sliding the indicator bar you can alter the indicator parameter to create as smooth or rough a representation of the prices as you like.

After you choose Technical Studies from the Study menu in SlopeCharts, you can double-click the Zig Zag indicator from the scrollable list. You are presented with two parameters: the first, a slider bar, lets you control the percentage threshold at which the line segments of the chart change direction, and the second lets you choose which color to use for the line.

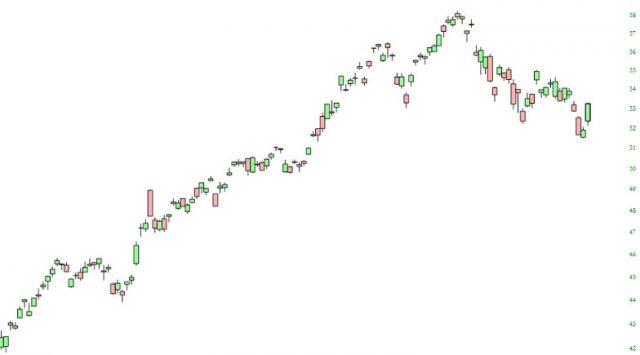
Here is an example of how Zig Zag can make a chart easier to interpret. This is a chart of the emerging markets fund, symbol EEM.

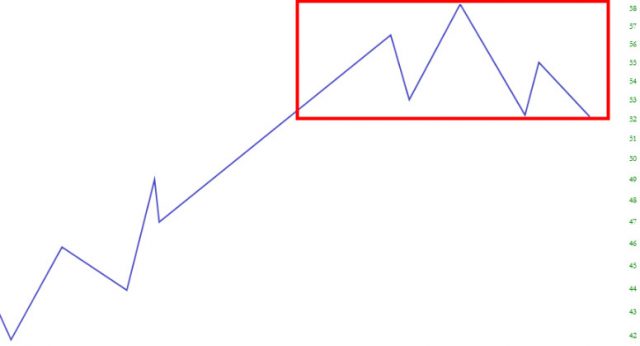
By applying the Zig Zag indicator, a simplified view of the price action is provided, and it makes the head and shoulders topping pattern much easier to discern. In this instance, the price bars have been hidden (by way of pressing Ctrl-P on the keyboard) in order to make the Zig Zag very plain to see.

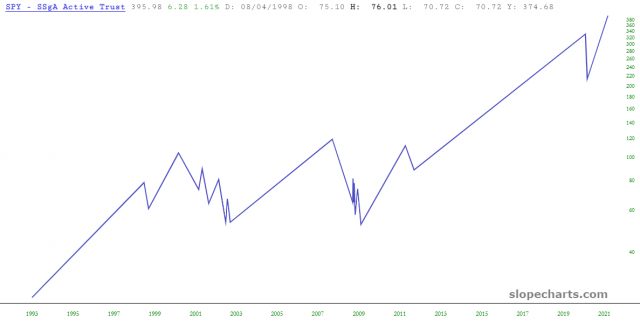
For a longer-term example, below is the biggest ETF in the world, the SPY, over a period of many decades. Each bar represents one day, so there are thousands upon thousands of individual bars comprising the chart.

Using the Zig Zag, and adjusting it for its crudest granularity, the major bull and bear markets are revealed. What is particularly interesting about this “boiled down to its essence” view is that it vividly shows how the very nature of the market has changed so dramatically. Even with this extremely restrictive Zig Zag setting, there was still some volatility during the bear market of 2000-2002 (note the series of zigs and zags). During the Great Financial Crisis, there were only a couple of fluctuations. Most recently, the Covid Crash of early 2000 didn’t register a single extra “zig” or “zag”. It merely went down and then recovered without so much as a bobble.


