
This came through on my Twitter feed Wednesday:
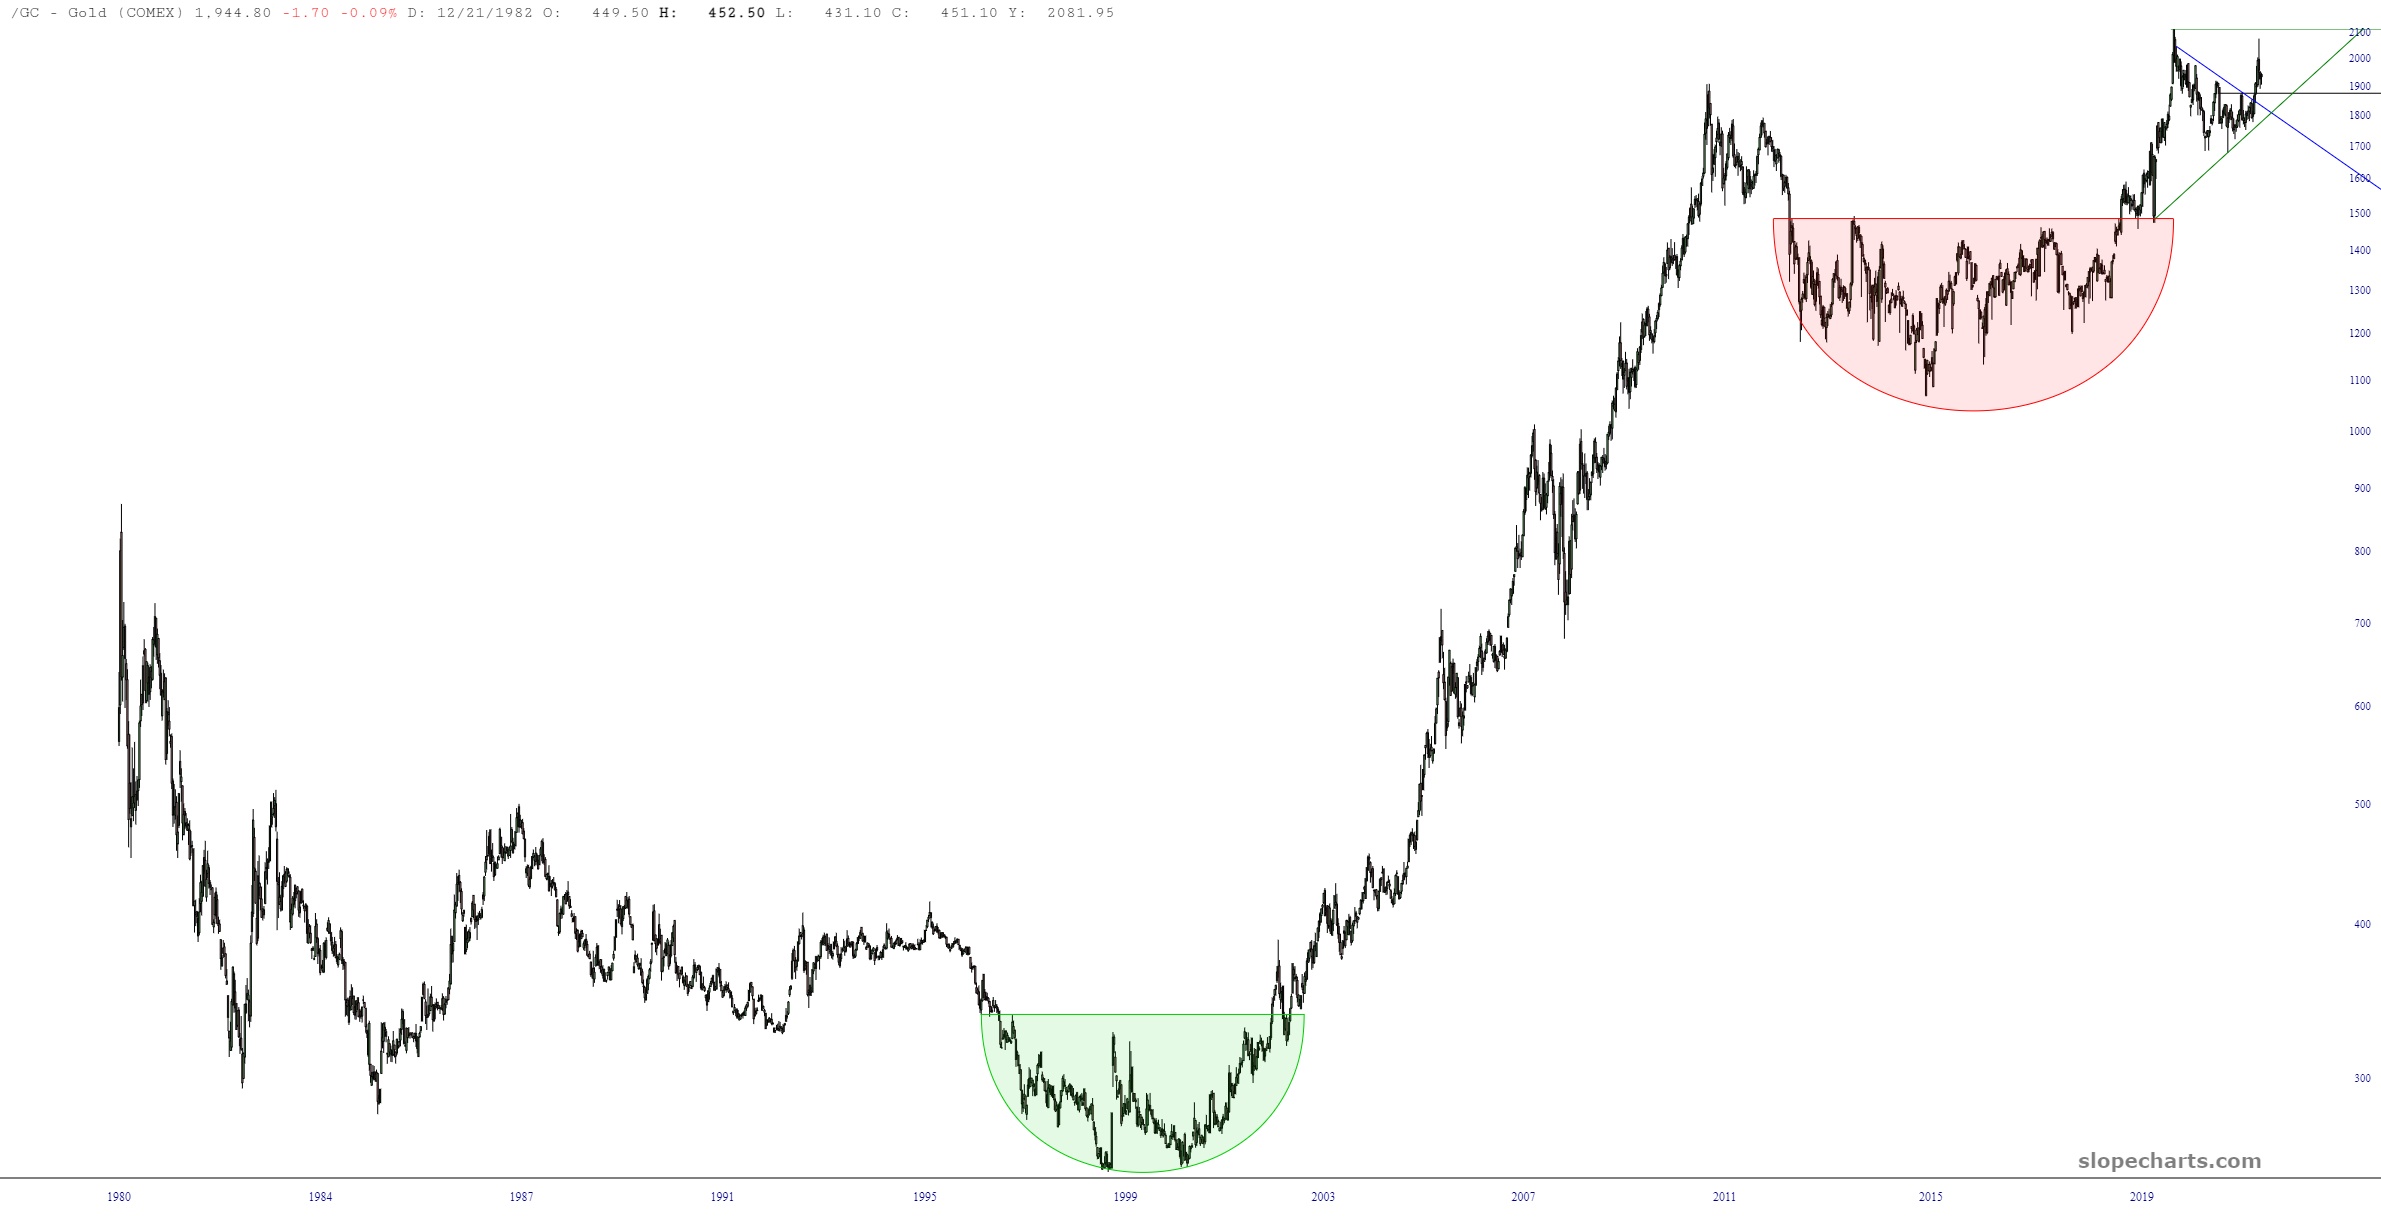
Well, here’s the continuous contract of gold as far back as I’ve got it………
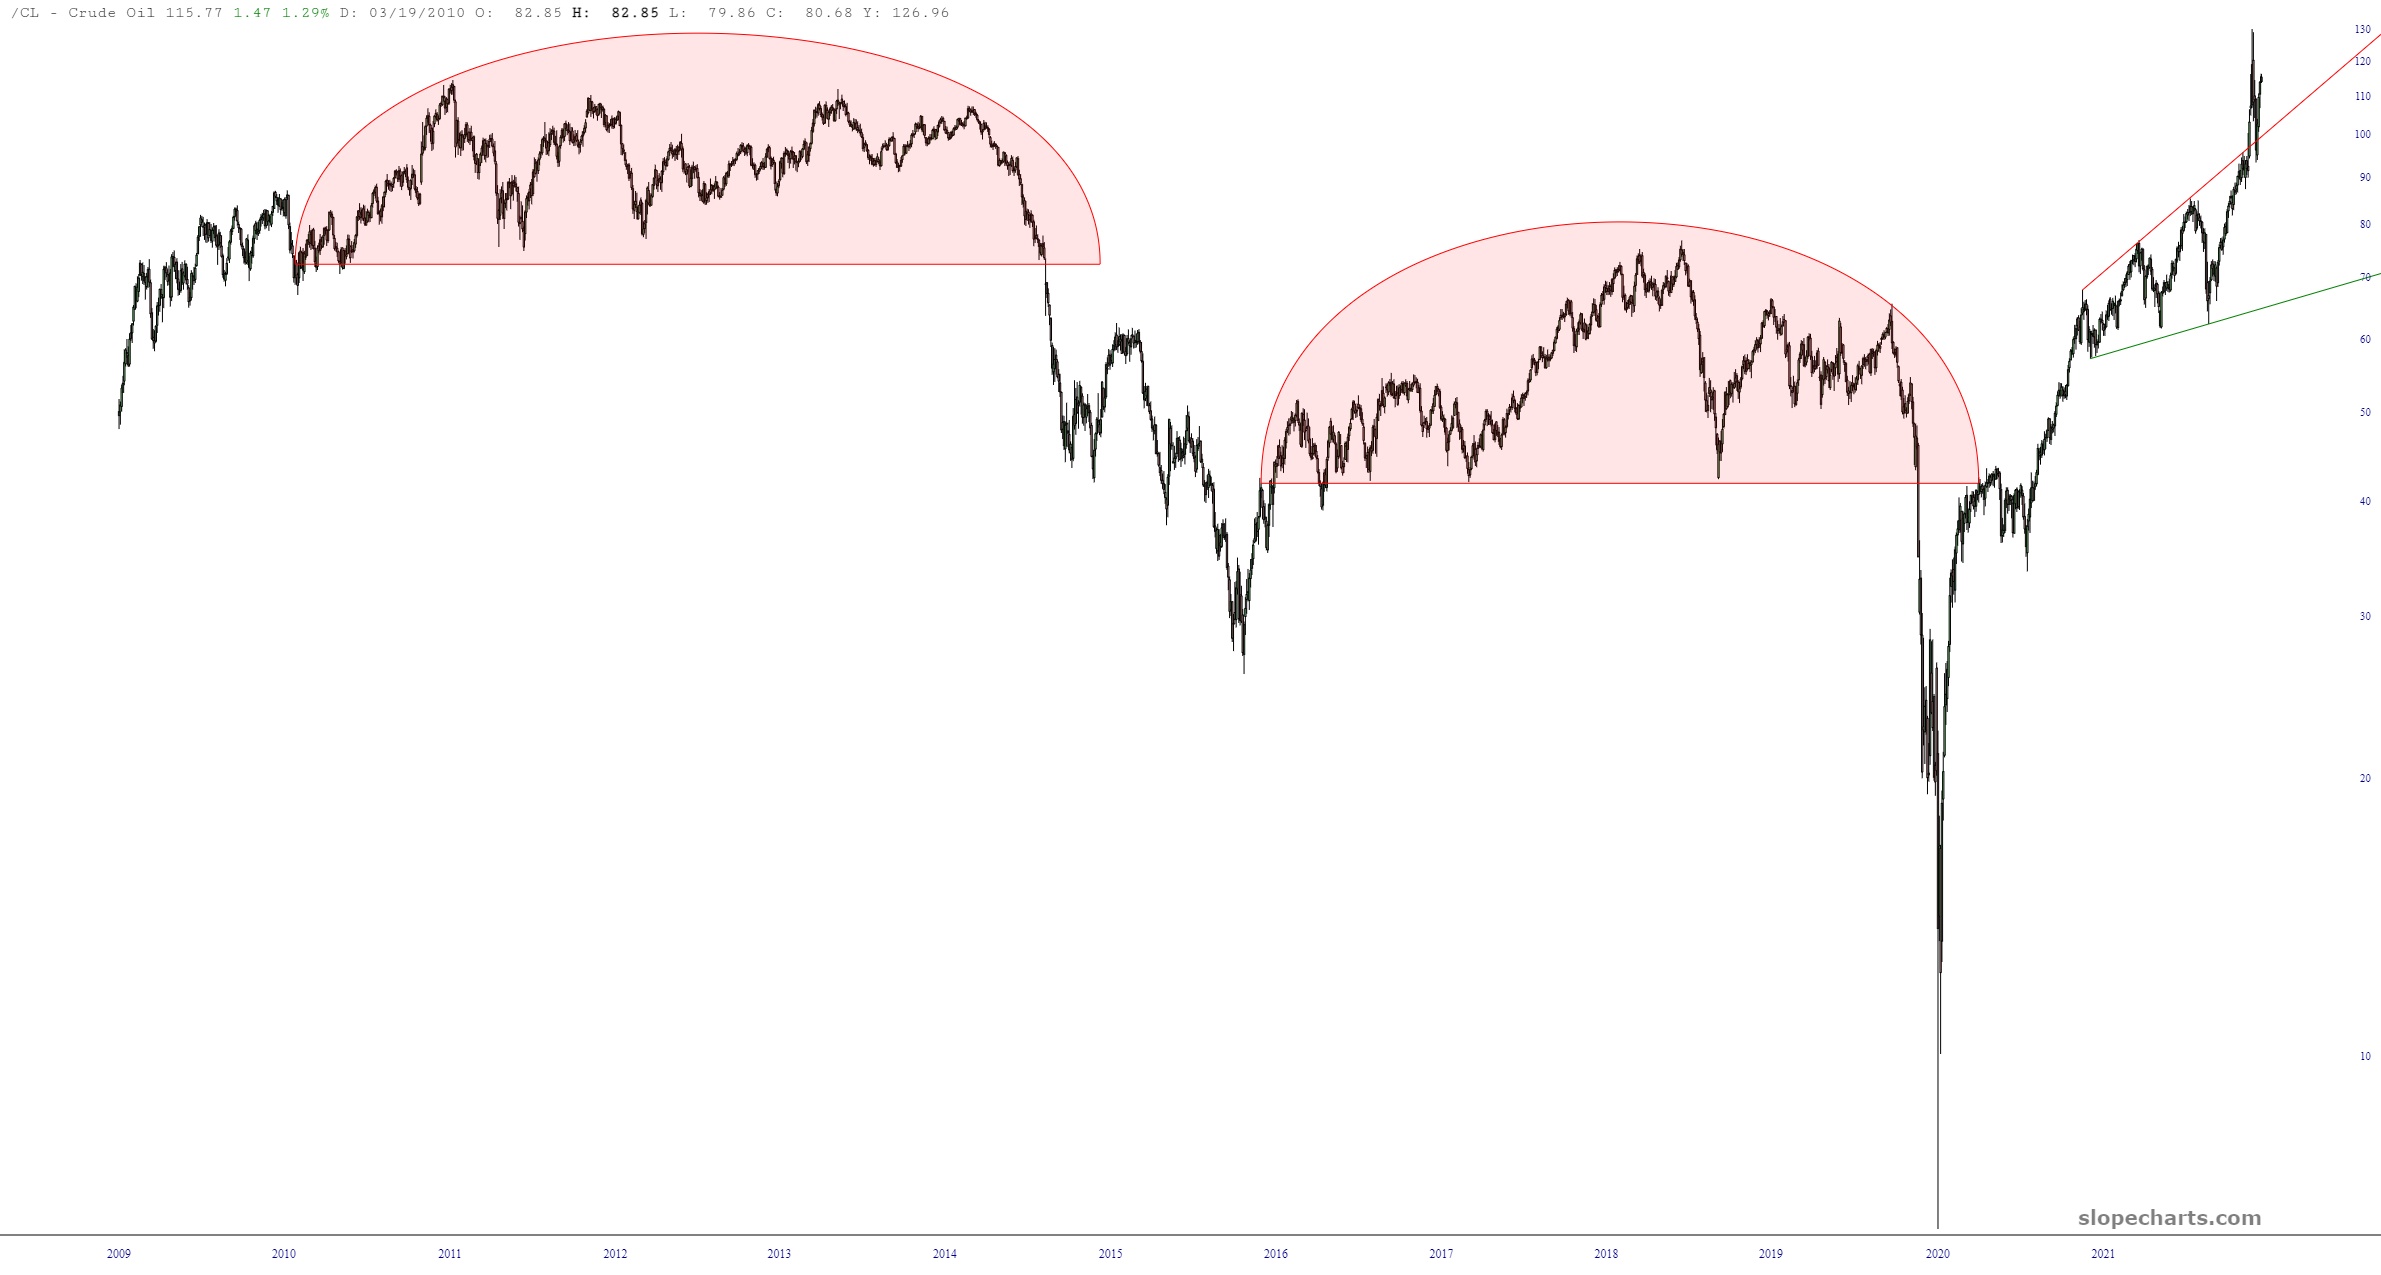
And here is crude oil, which goes back decades, but not as far as gold…….
I divided crude oil by gold, and I’ve tinted the hell out of it. Here’s what I came up with.
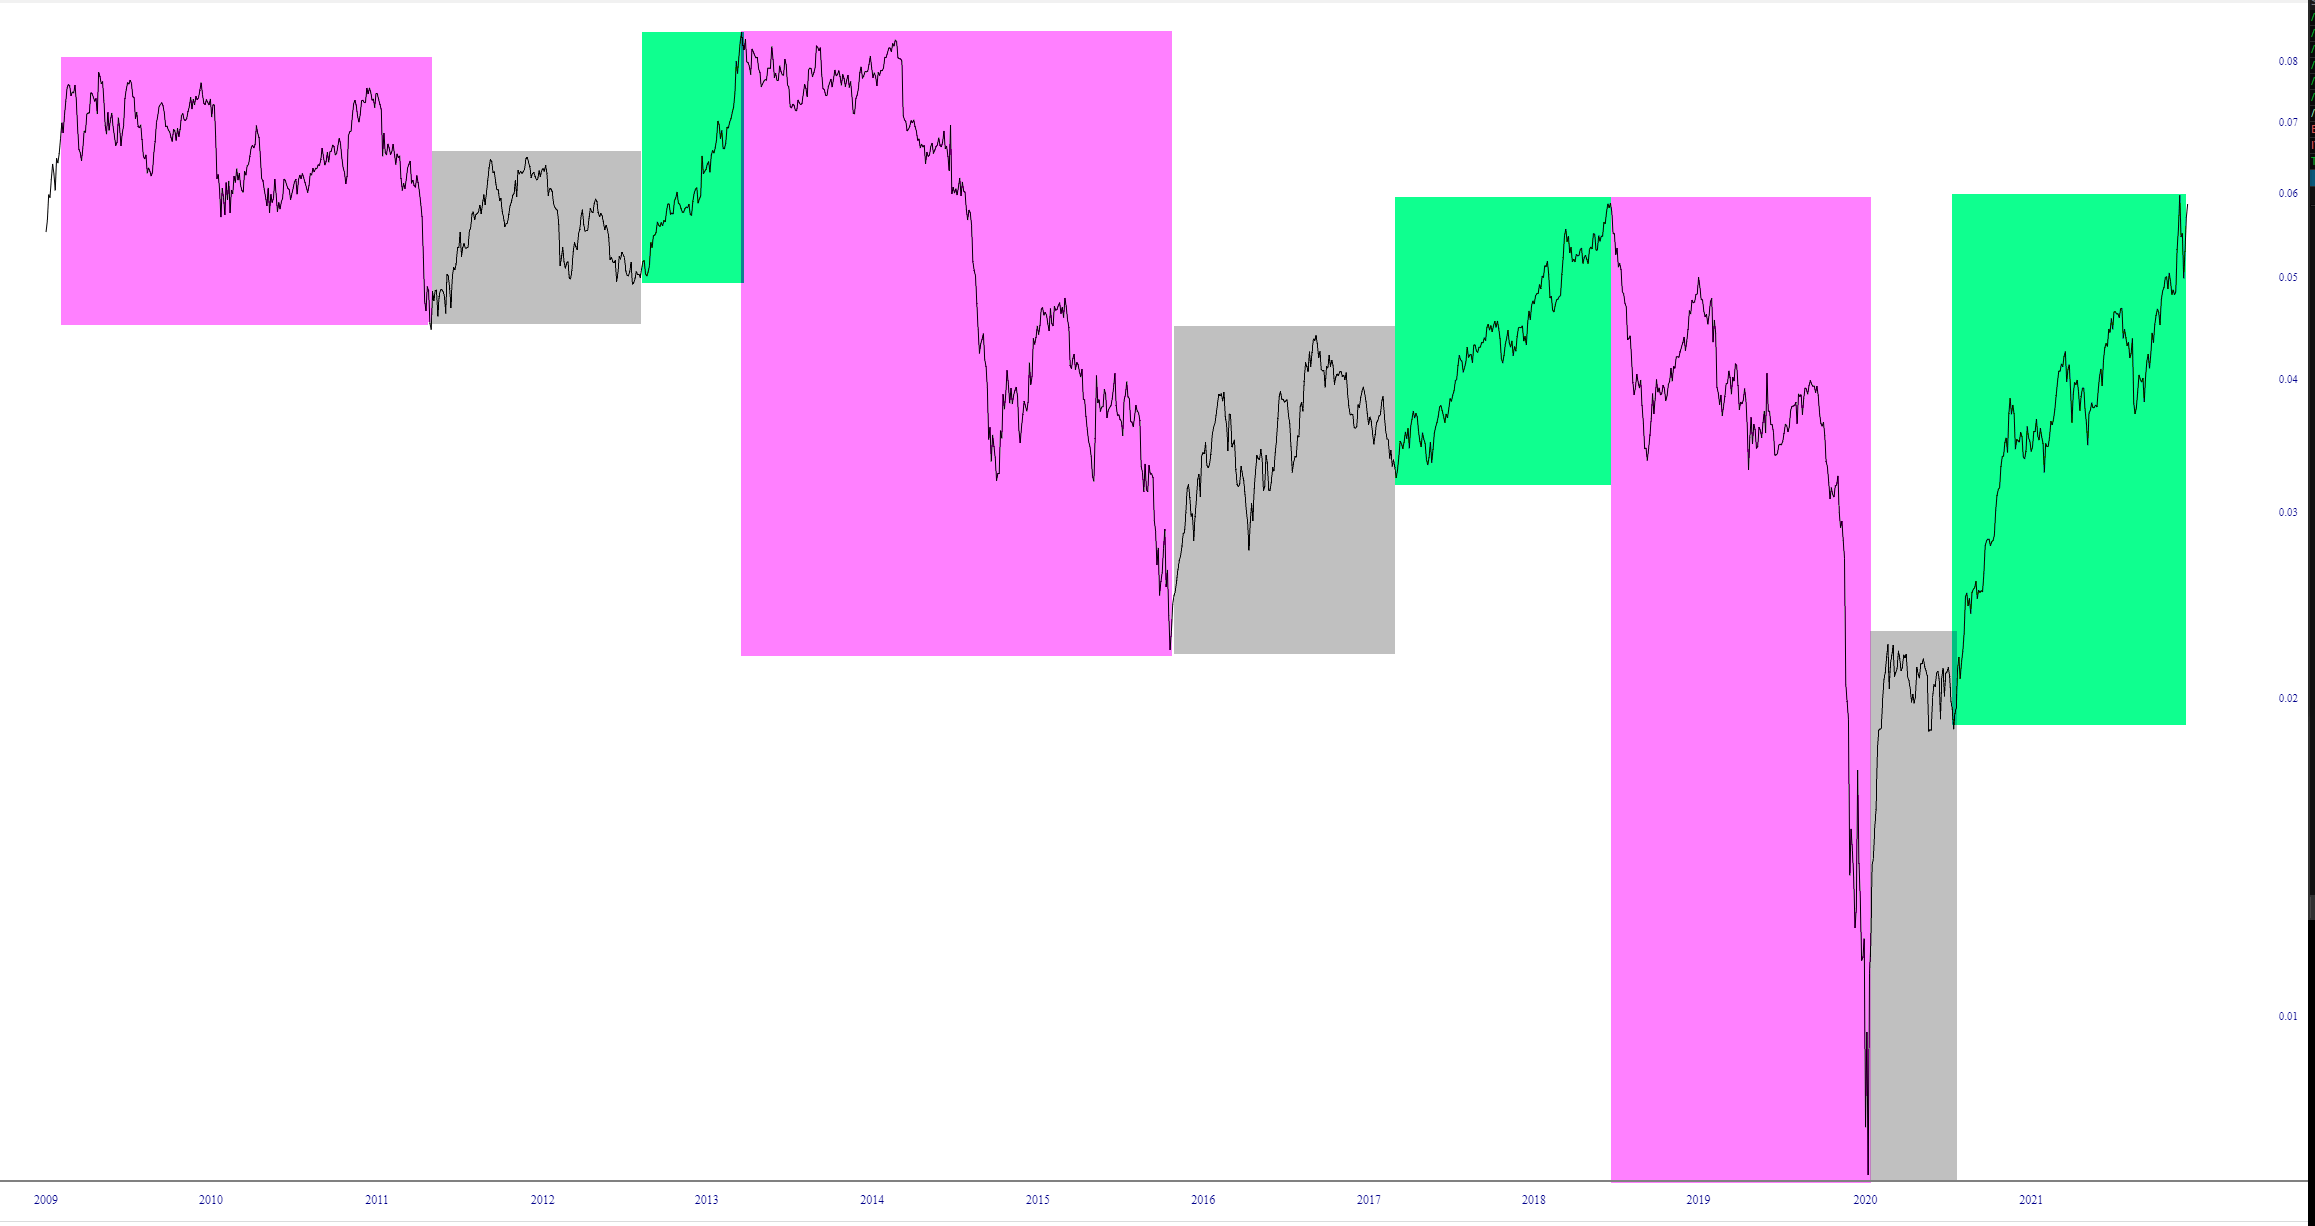
The “phases” I see cycling through this ratio chart are:
- Magenta – the bear market phase in which energy weakens against gold. As you can see, of the three instances, the 2nd is worse than the 1st, and the 3rd is much, much word than either of them.
- Grey – this is the recovery and stability phase. These have been proportionate in robustness to their companion magenta zones.
- Green – this is the bull market, in which energy is much stronger than gold. This most recent period, it has been insanely strong.
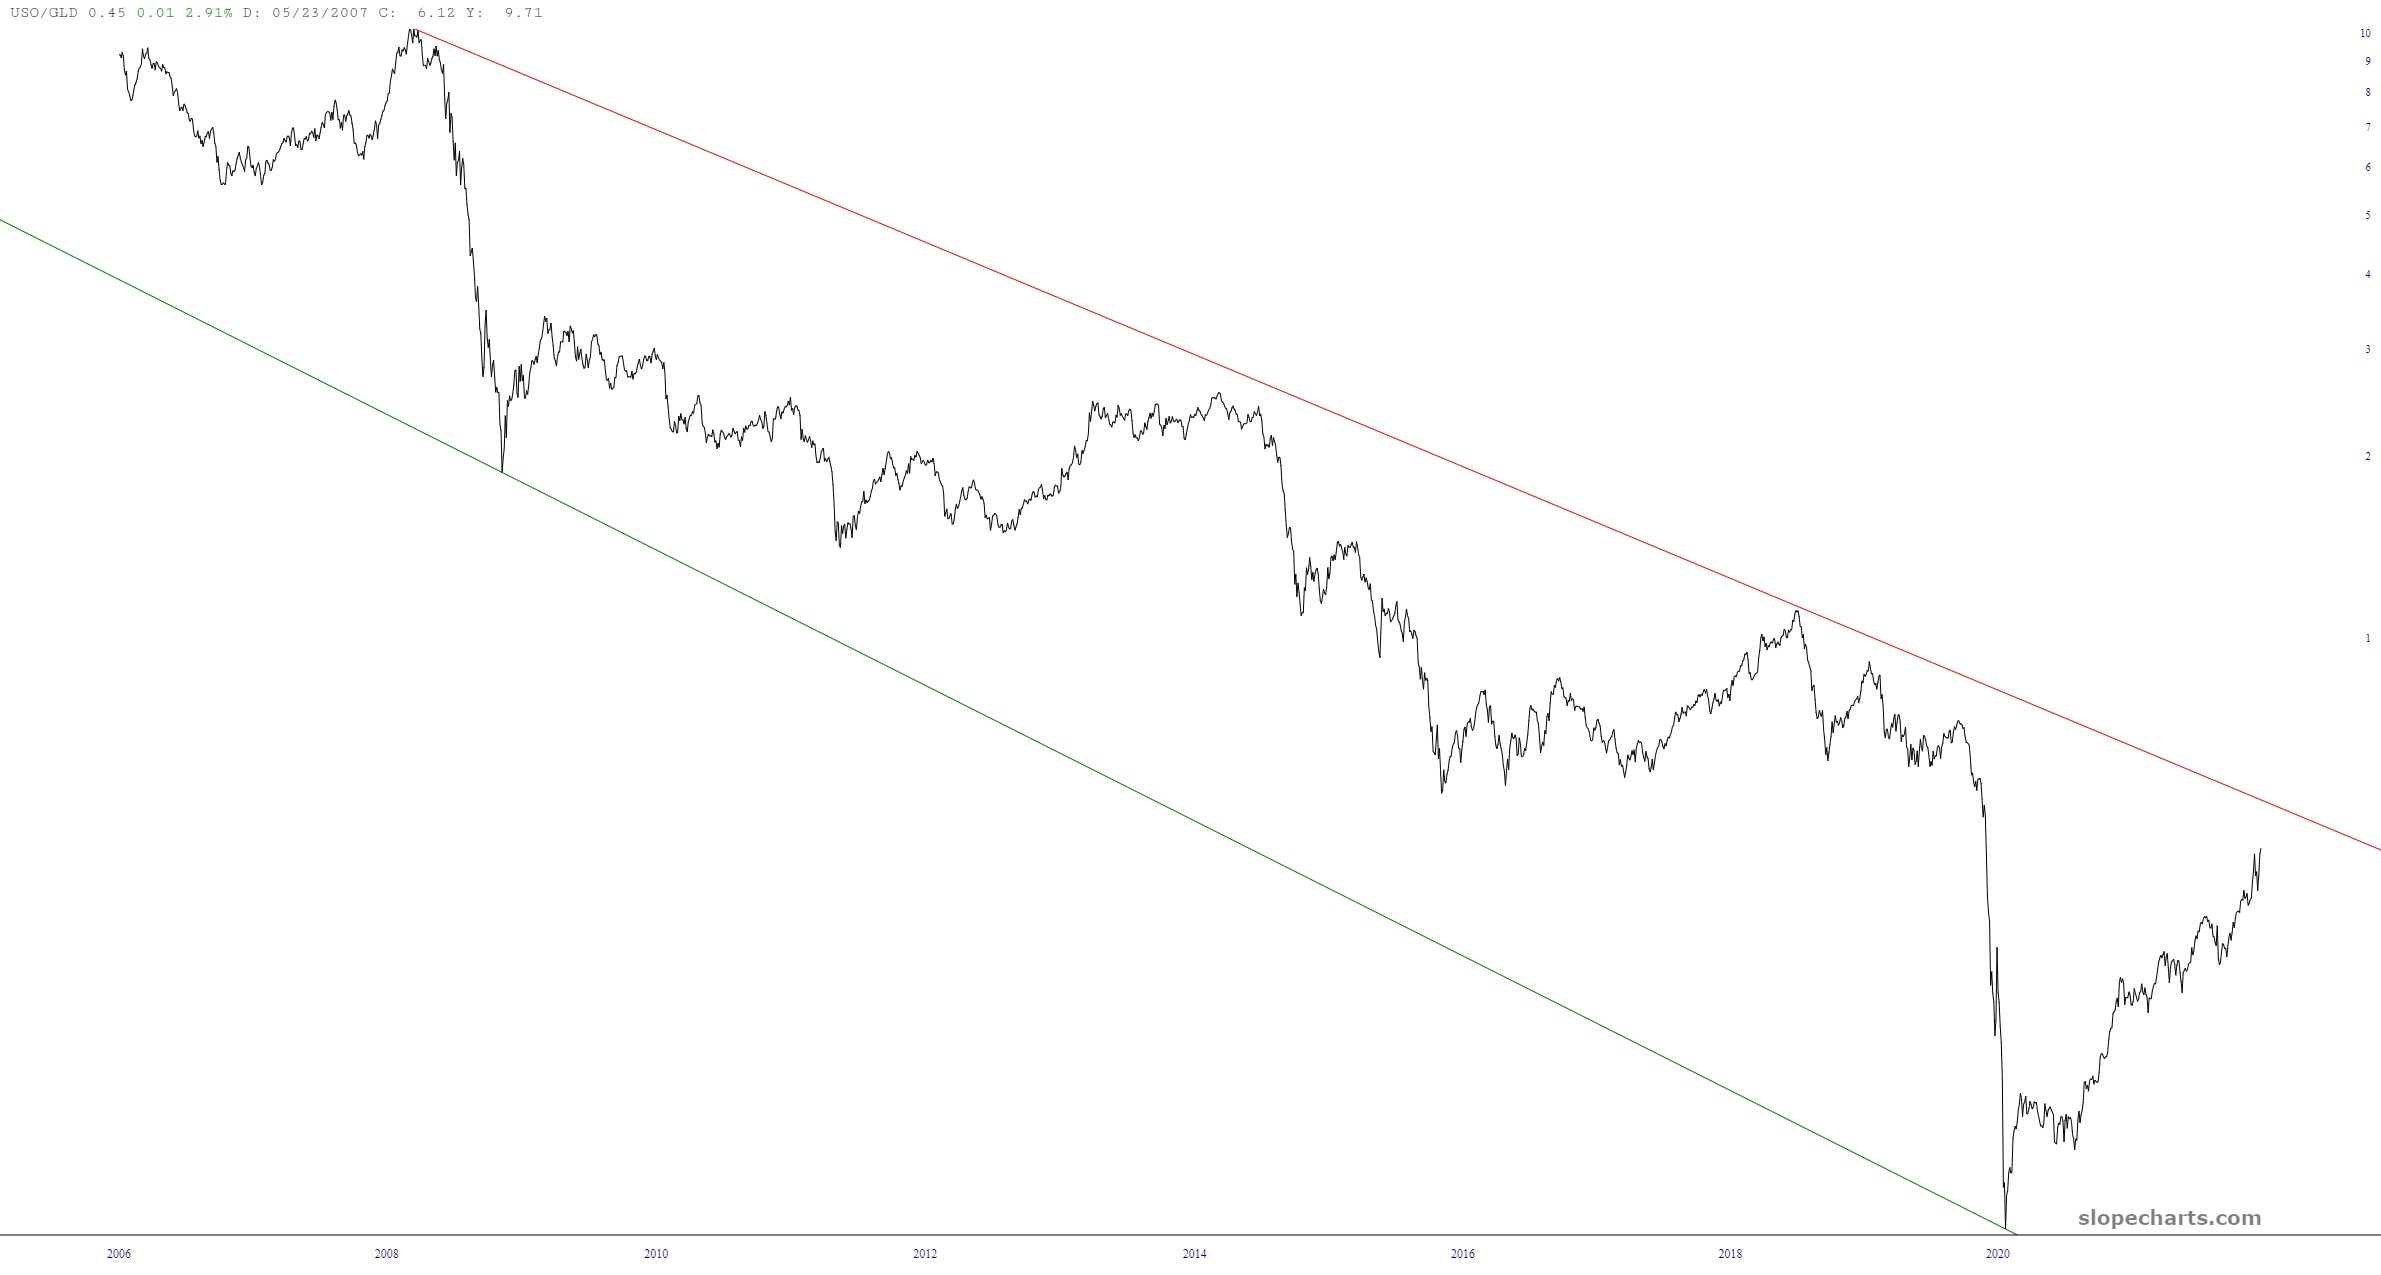
As one other perspective into this whole question, here is the very simple USO/GLD chart (of course, USO degrades badly against oil itself, but it’s still an interesting chart).
My conclusions:
- It won’t be long at all before gold starts overpowering crude oil with respect to price performance;
- Gold could SURGE in price, considering how cheap it is, historically, to crude oil.
