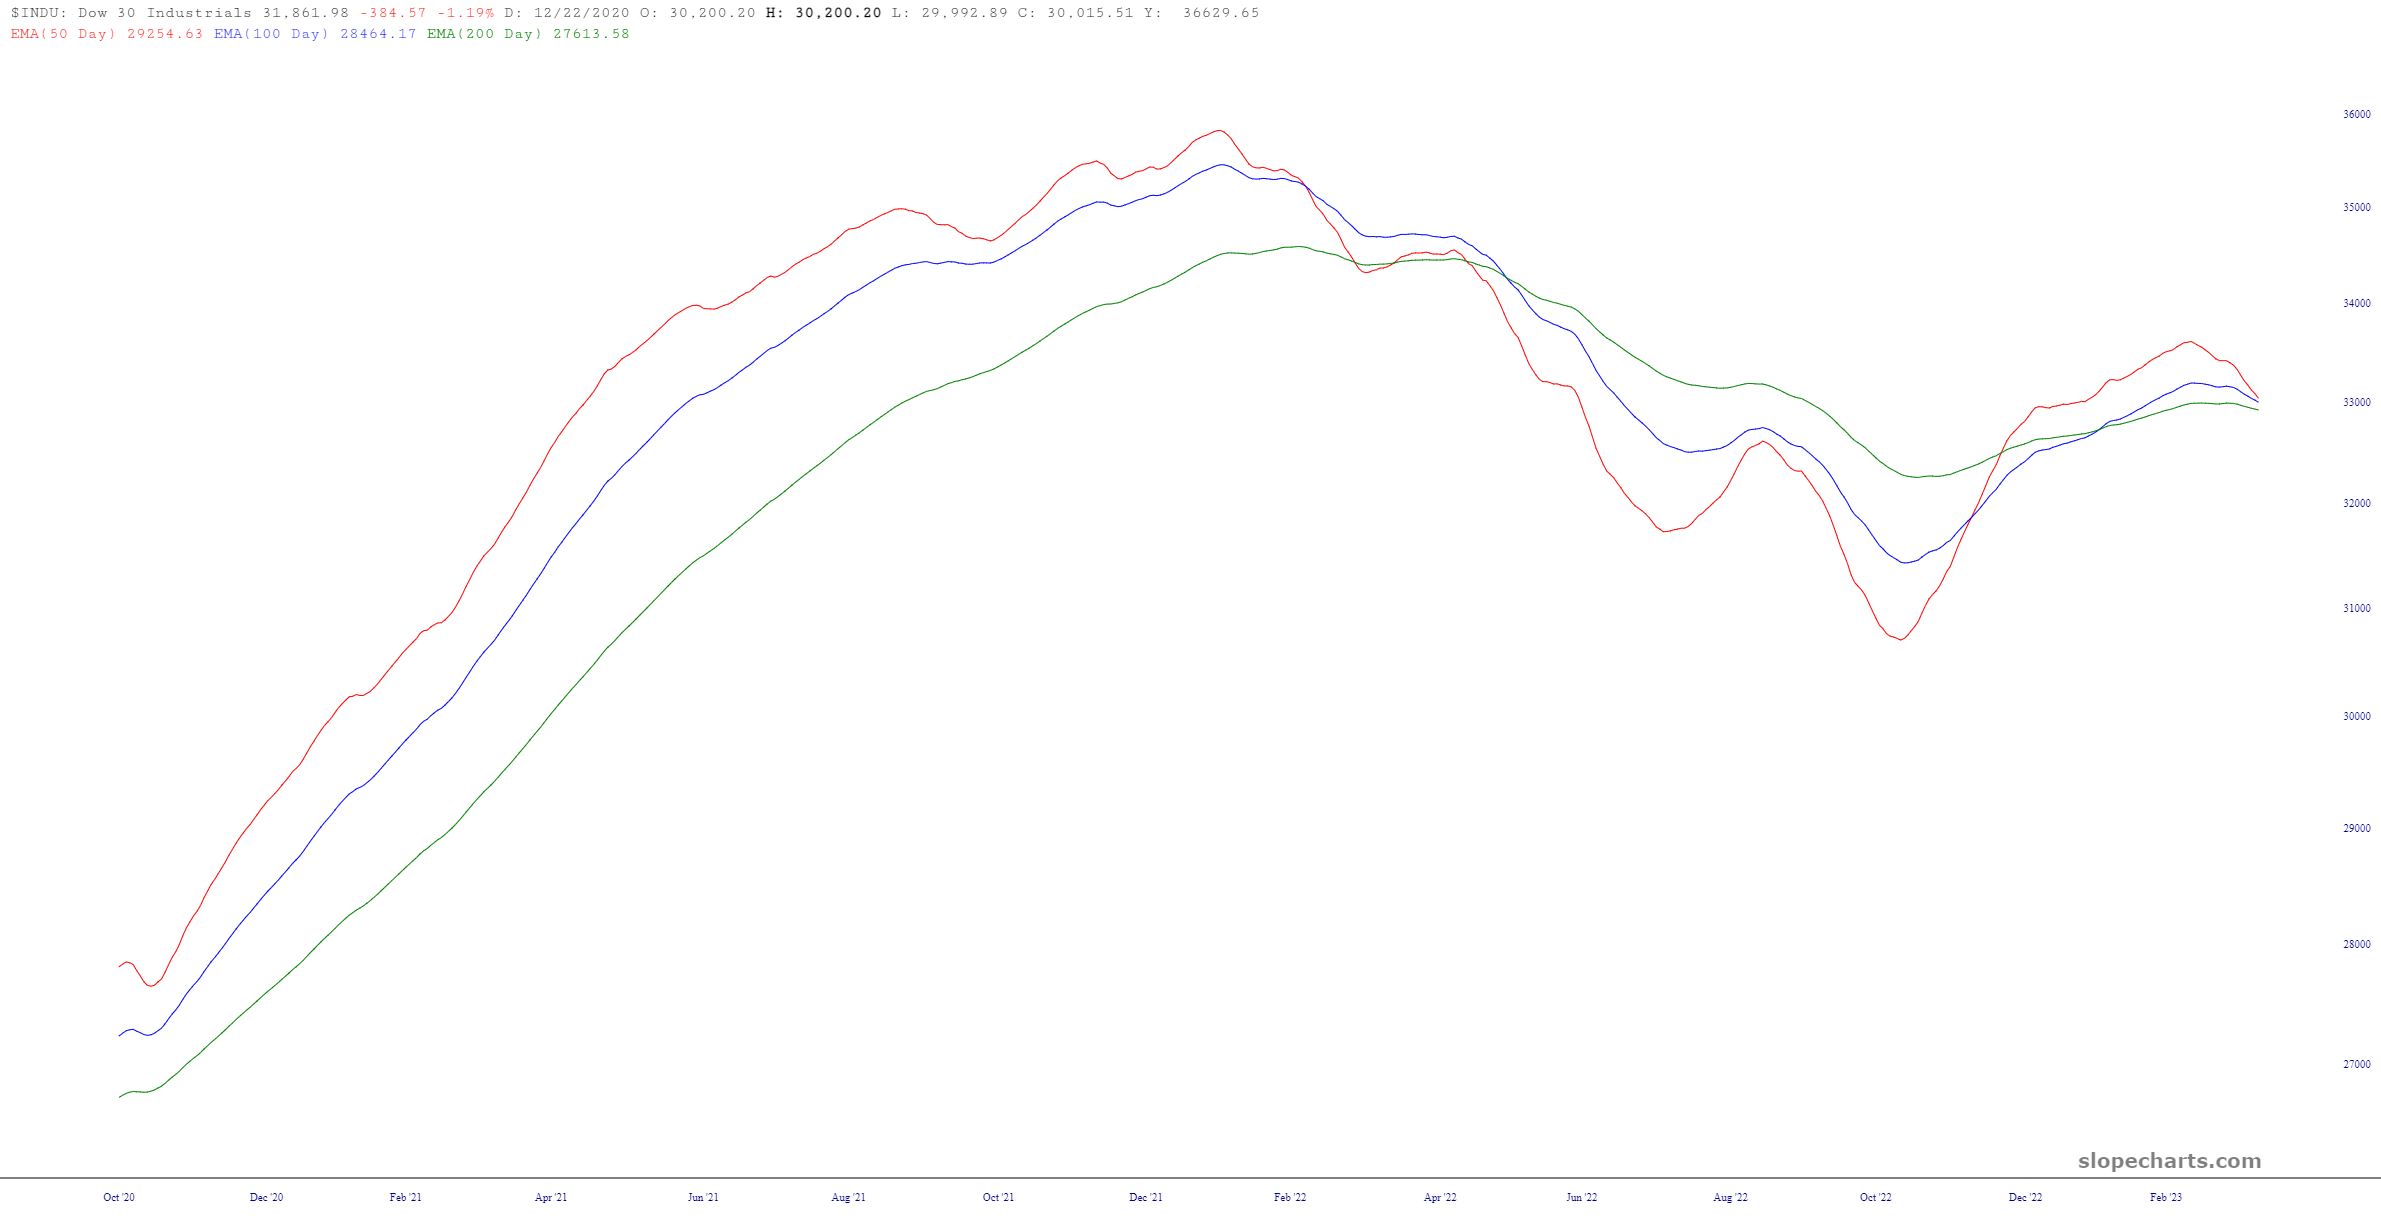
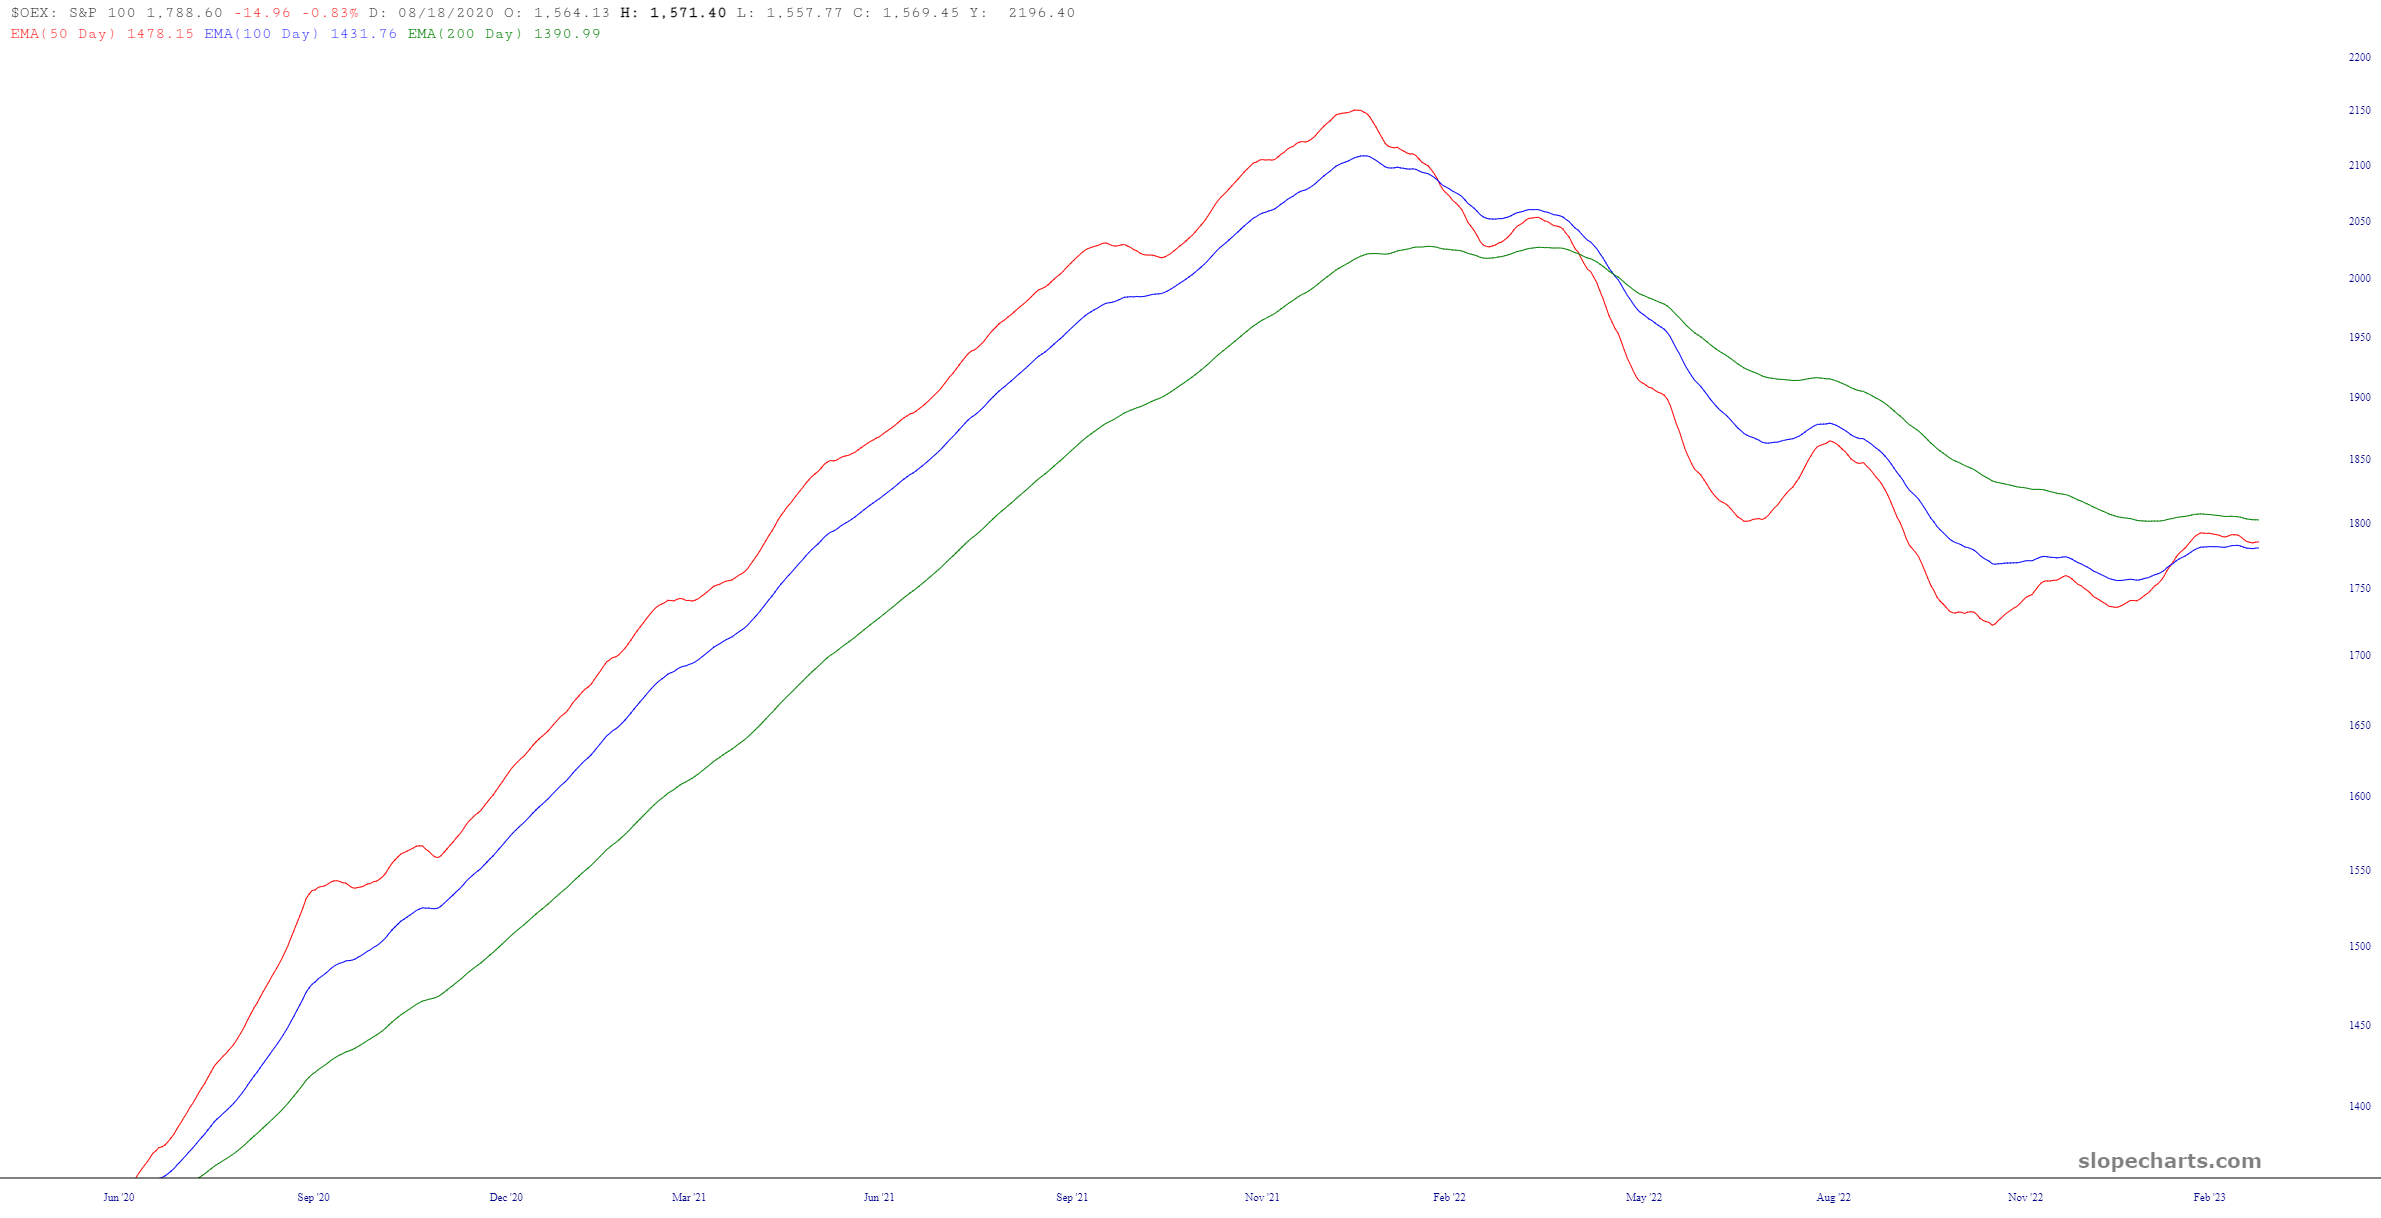
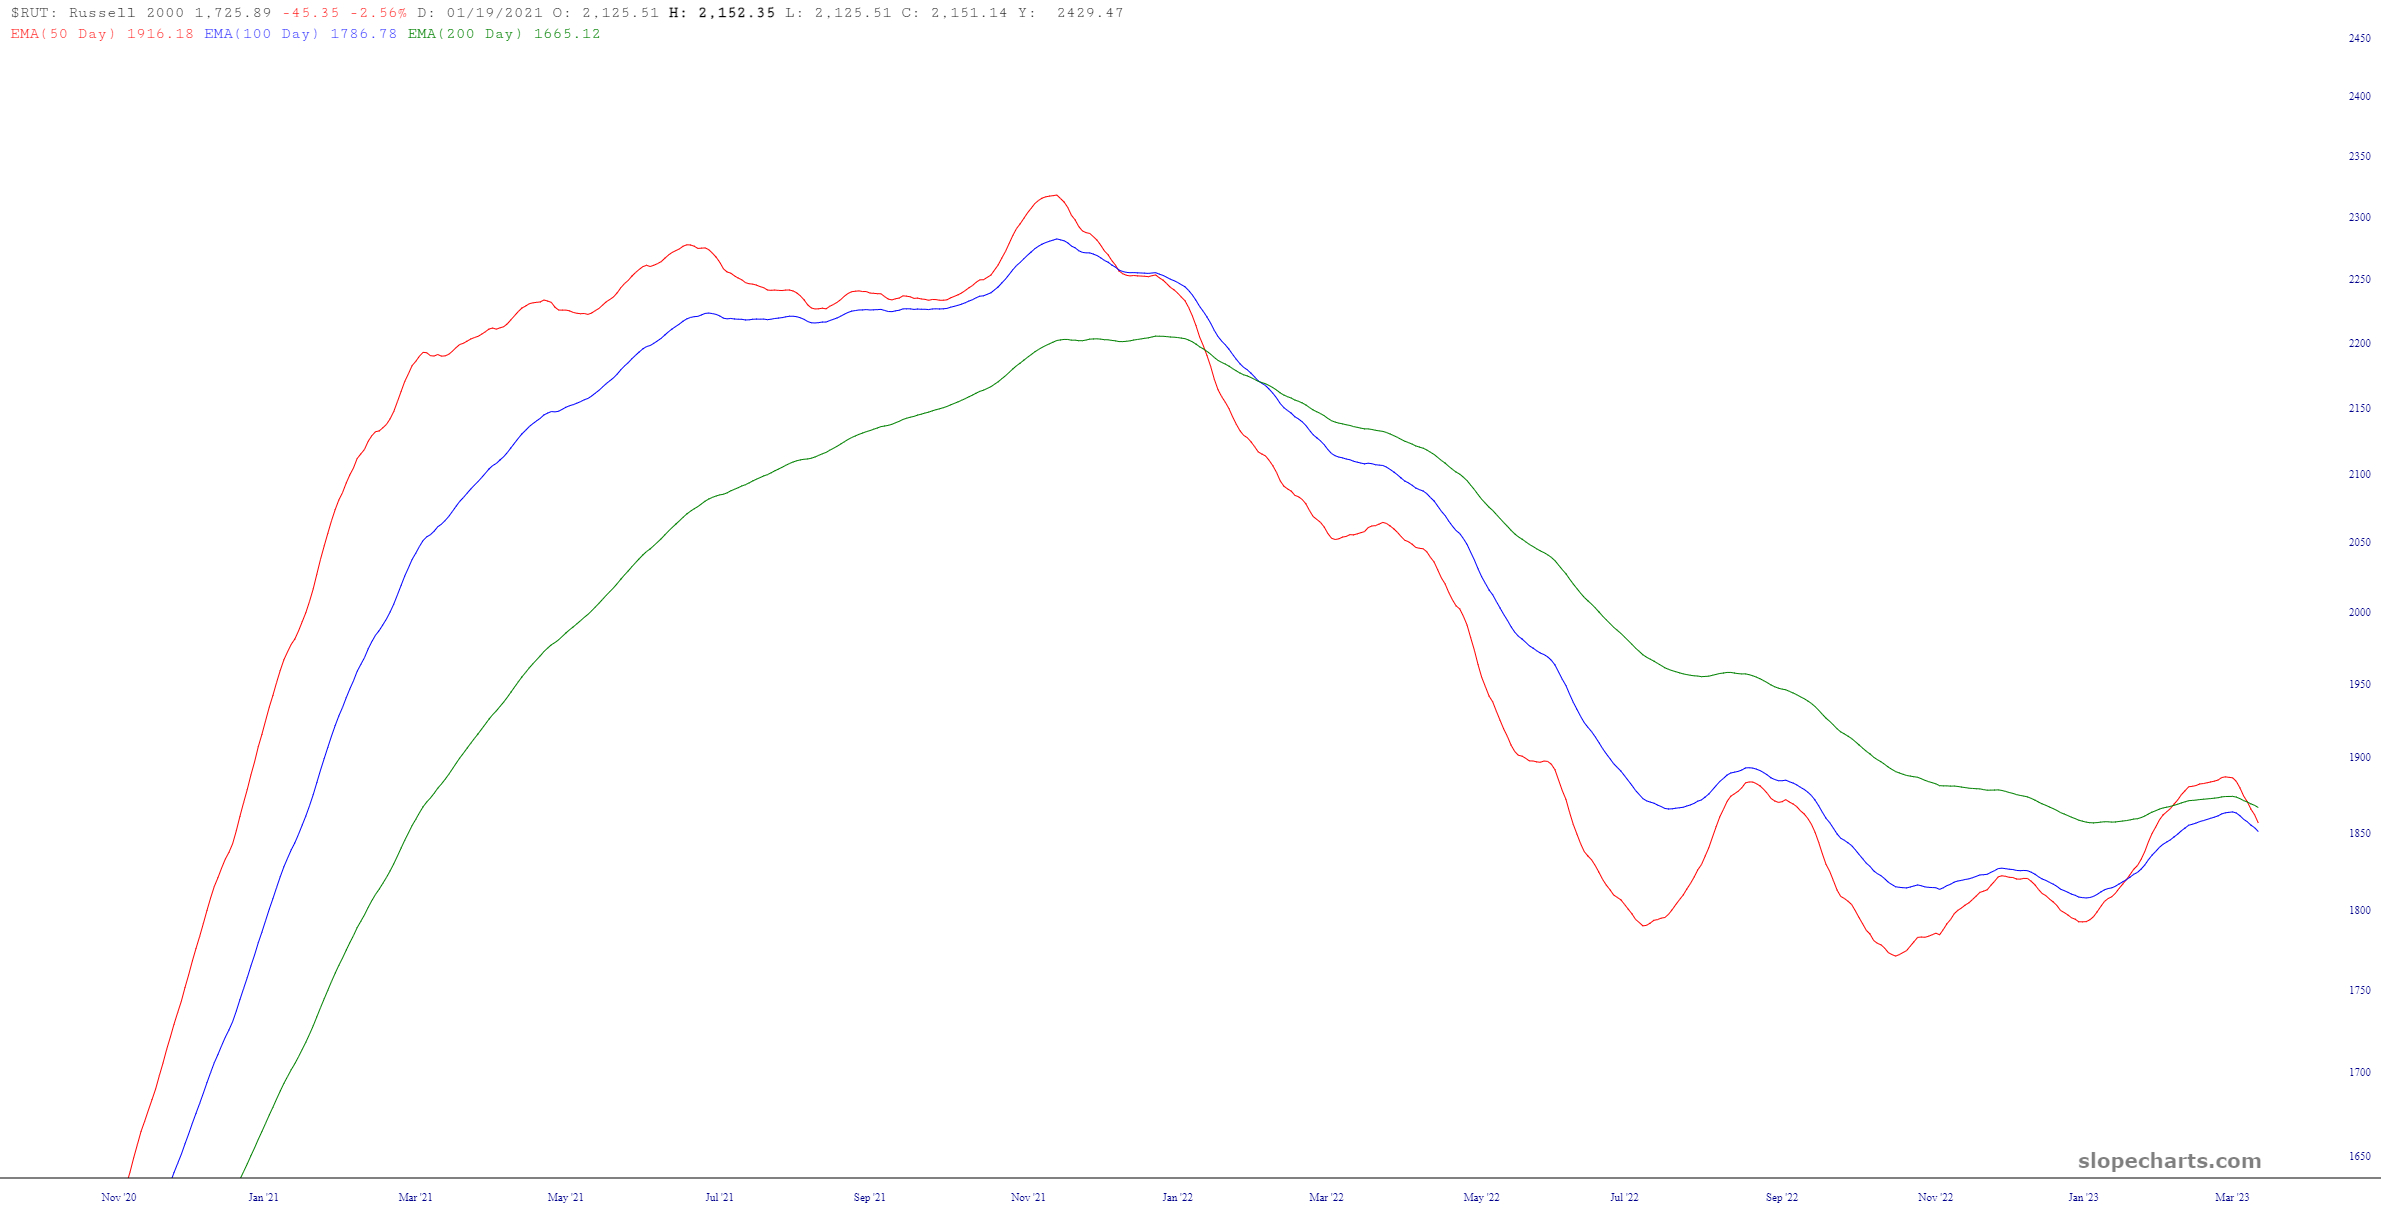
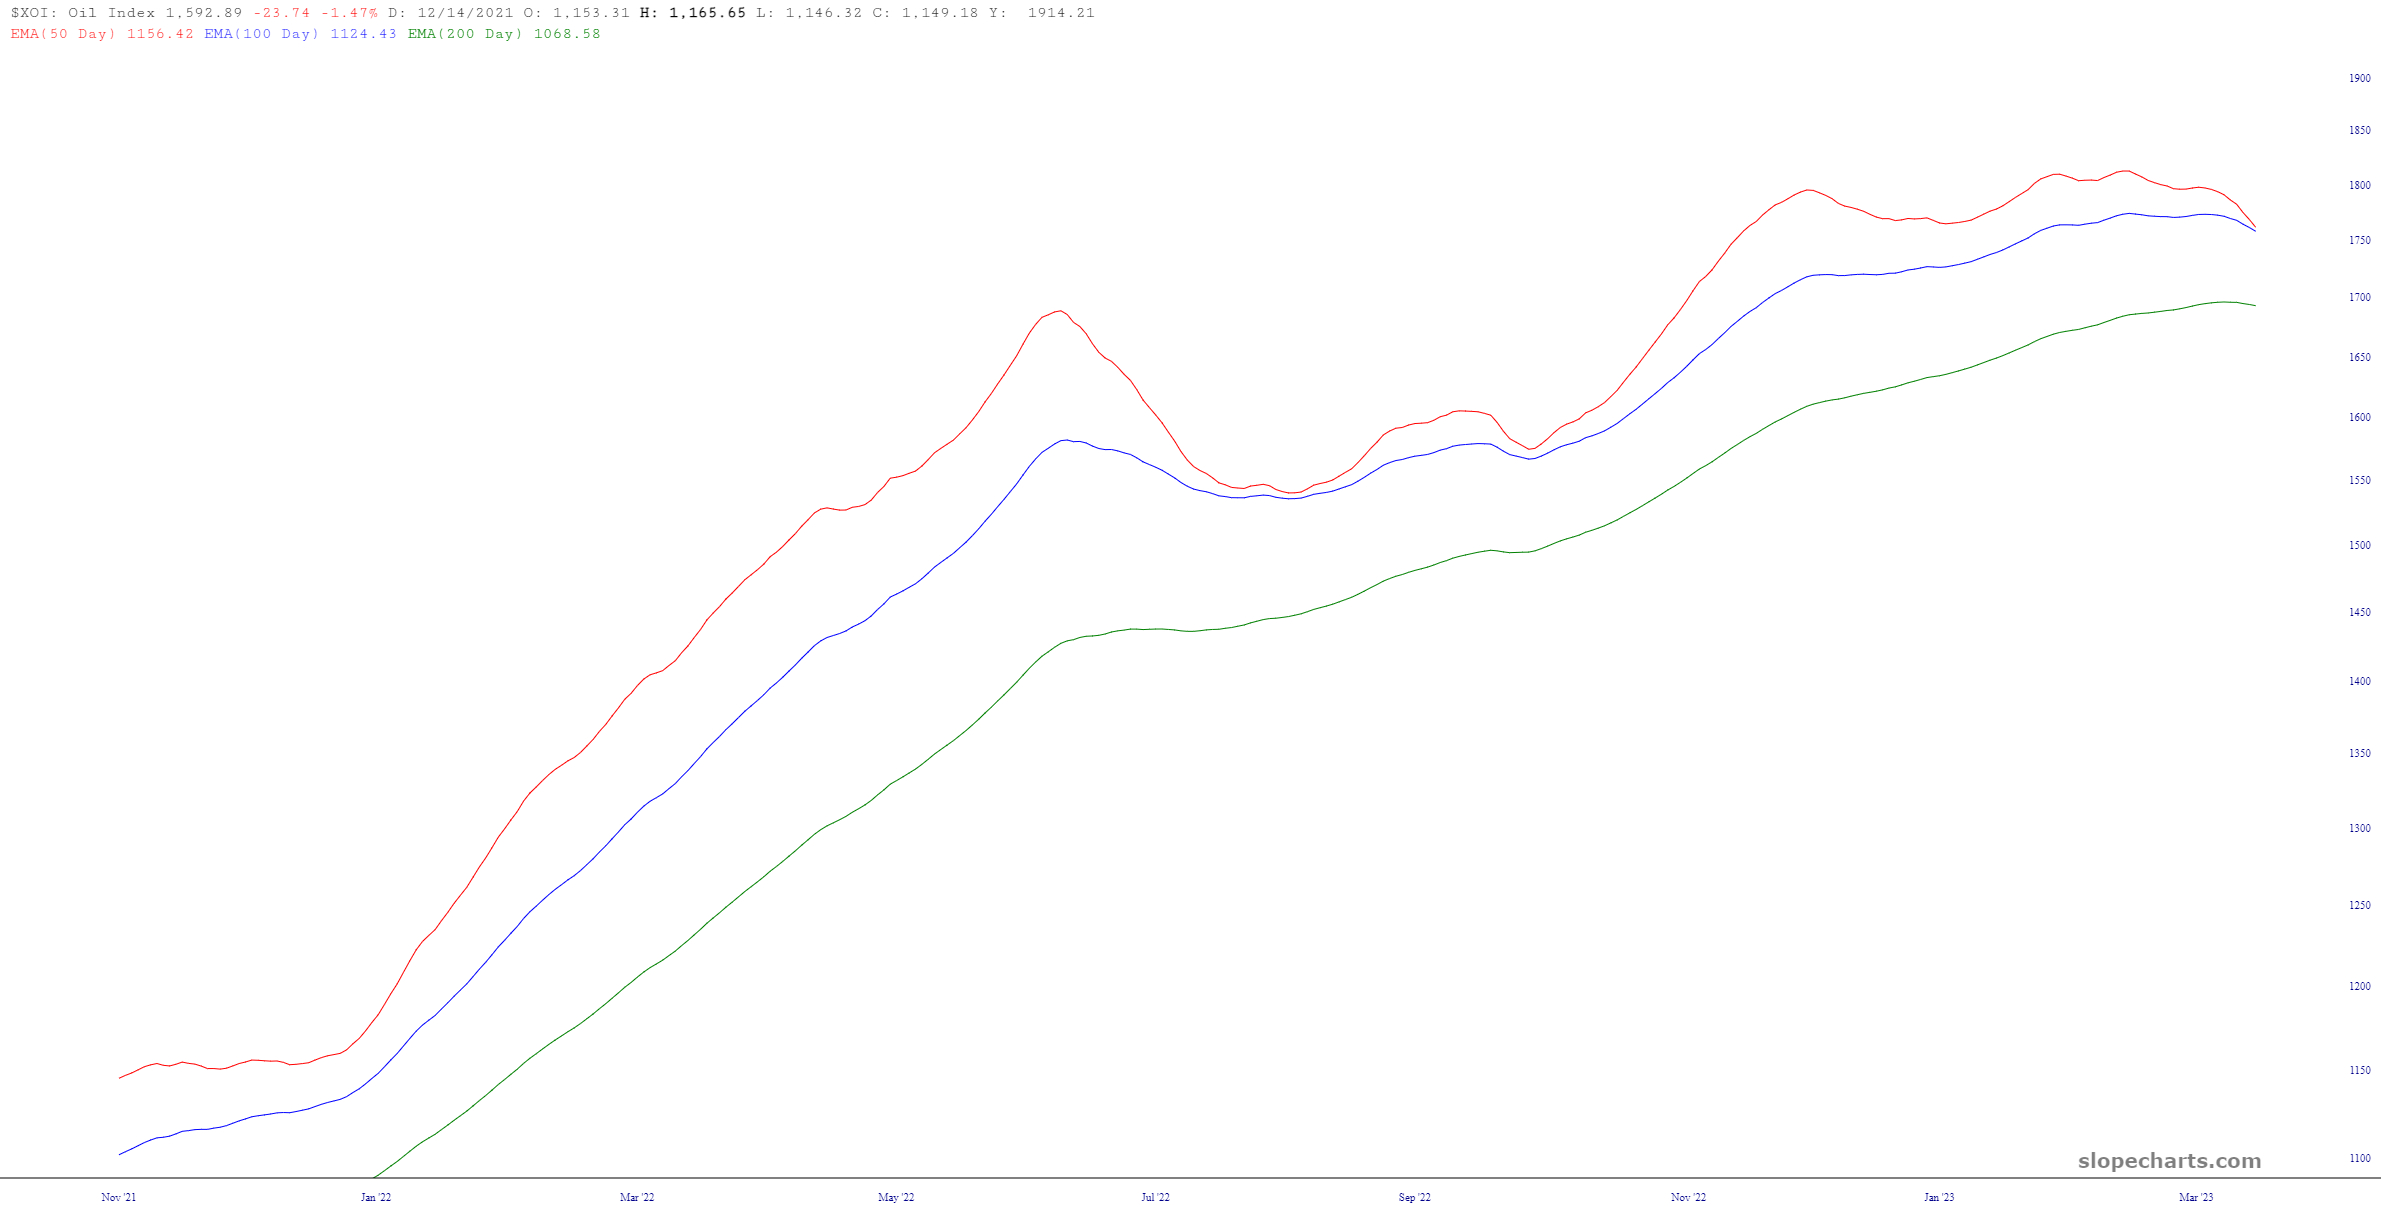
Strip away everything you can. Get rid of the trendlines. Remove the retracement patterns. Delete the tints. Even get rid of the price data itself! Just leave in place a trio of exponential moving averages: 50, 100, and 200. Draw your own conclusions. I’ve certainly drawn mine.
![](https://slopeofhope.com/wp-content/uploads/2023/03/slopechart_INDU-640x327.jpg)
![](https://slopeofhope.com/wp-content/uploads/2023/03/slopechart_OEX-640x327.jpg)
![](https://slopeofhope.com/wp-content/uploads/2023/03/slopechart_RUT-640x327.jpg)
![](https://slopeofhope.com/wp-content/uploads/2023/03/slopechart_SPX-4-640x327.jpg)
![](https://slopeofhope.com/wp-content/uploads/2023/03/slopechart_XOI-640x327.jpg)