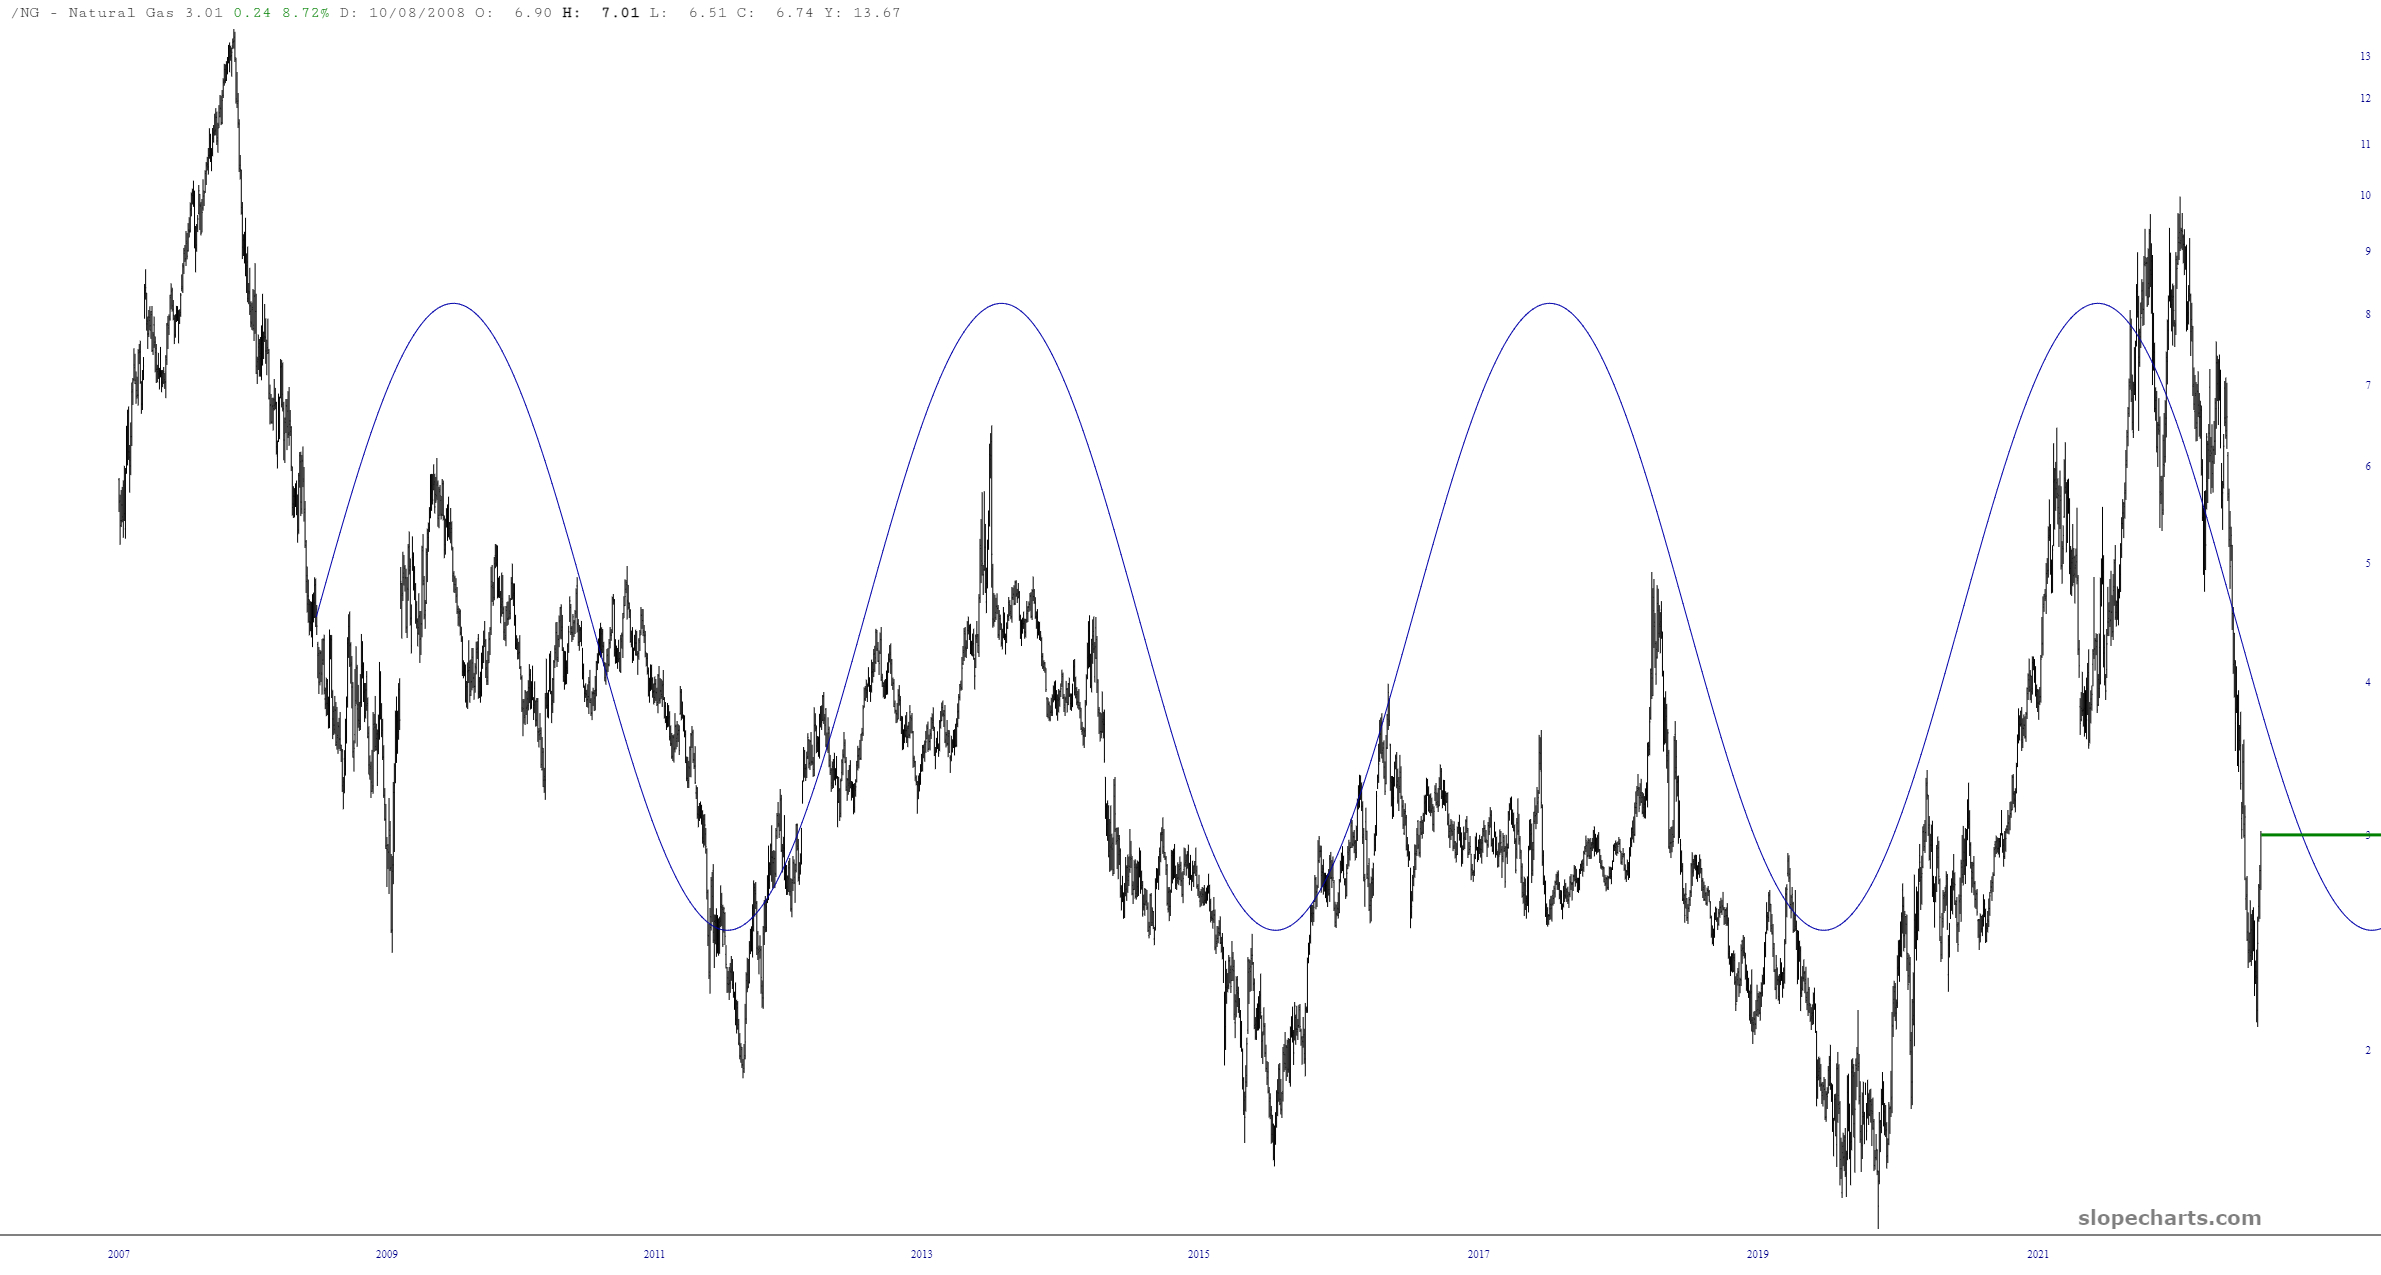
Early last year, I noticed something which I have never seen on any other chart before, which is a really magnificent application of the sine wave tool. In this instance, it seemed to follow the long-term path of natural gas beautifully, and it strongly suggested the commodity was in for a fall. Well, it did fall, and with a speed never seen before.