
Early last year, I noticed something which I have never seen on any other chart before, which is a really magnificent application of the sine wave tool. In this instance, it seemed to follow the long-term path of natural gas beautifully, and it strongly suggested the commodity was in for a fall. Well, it did fall, and with a speed never seen before.
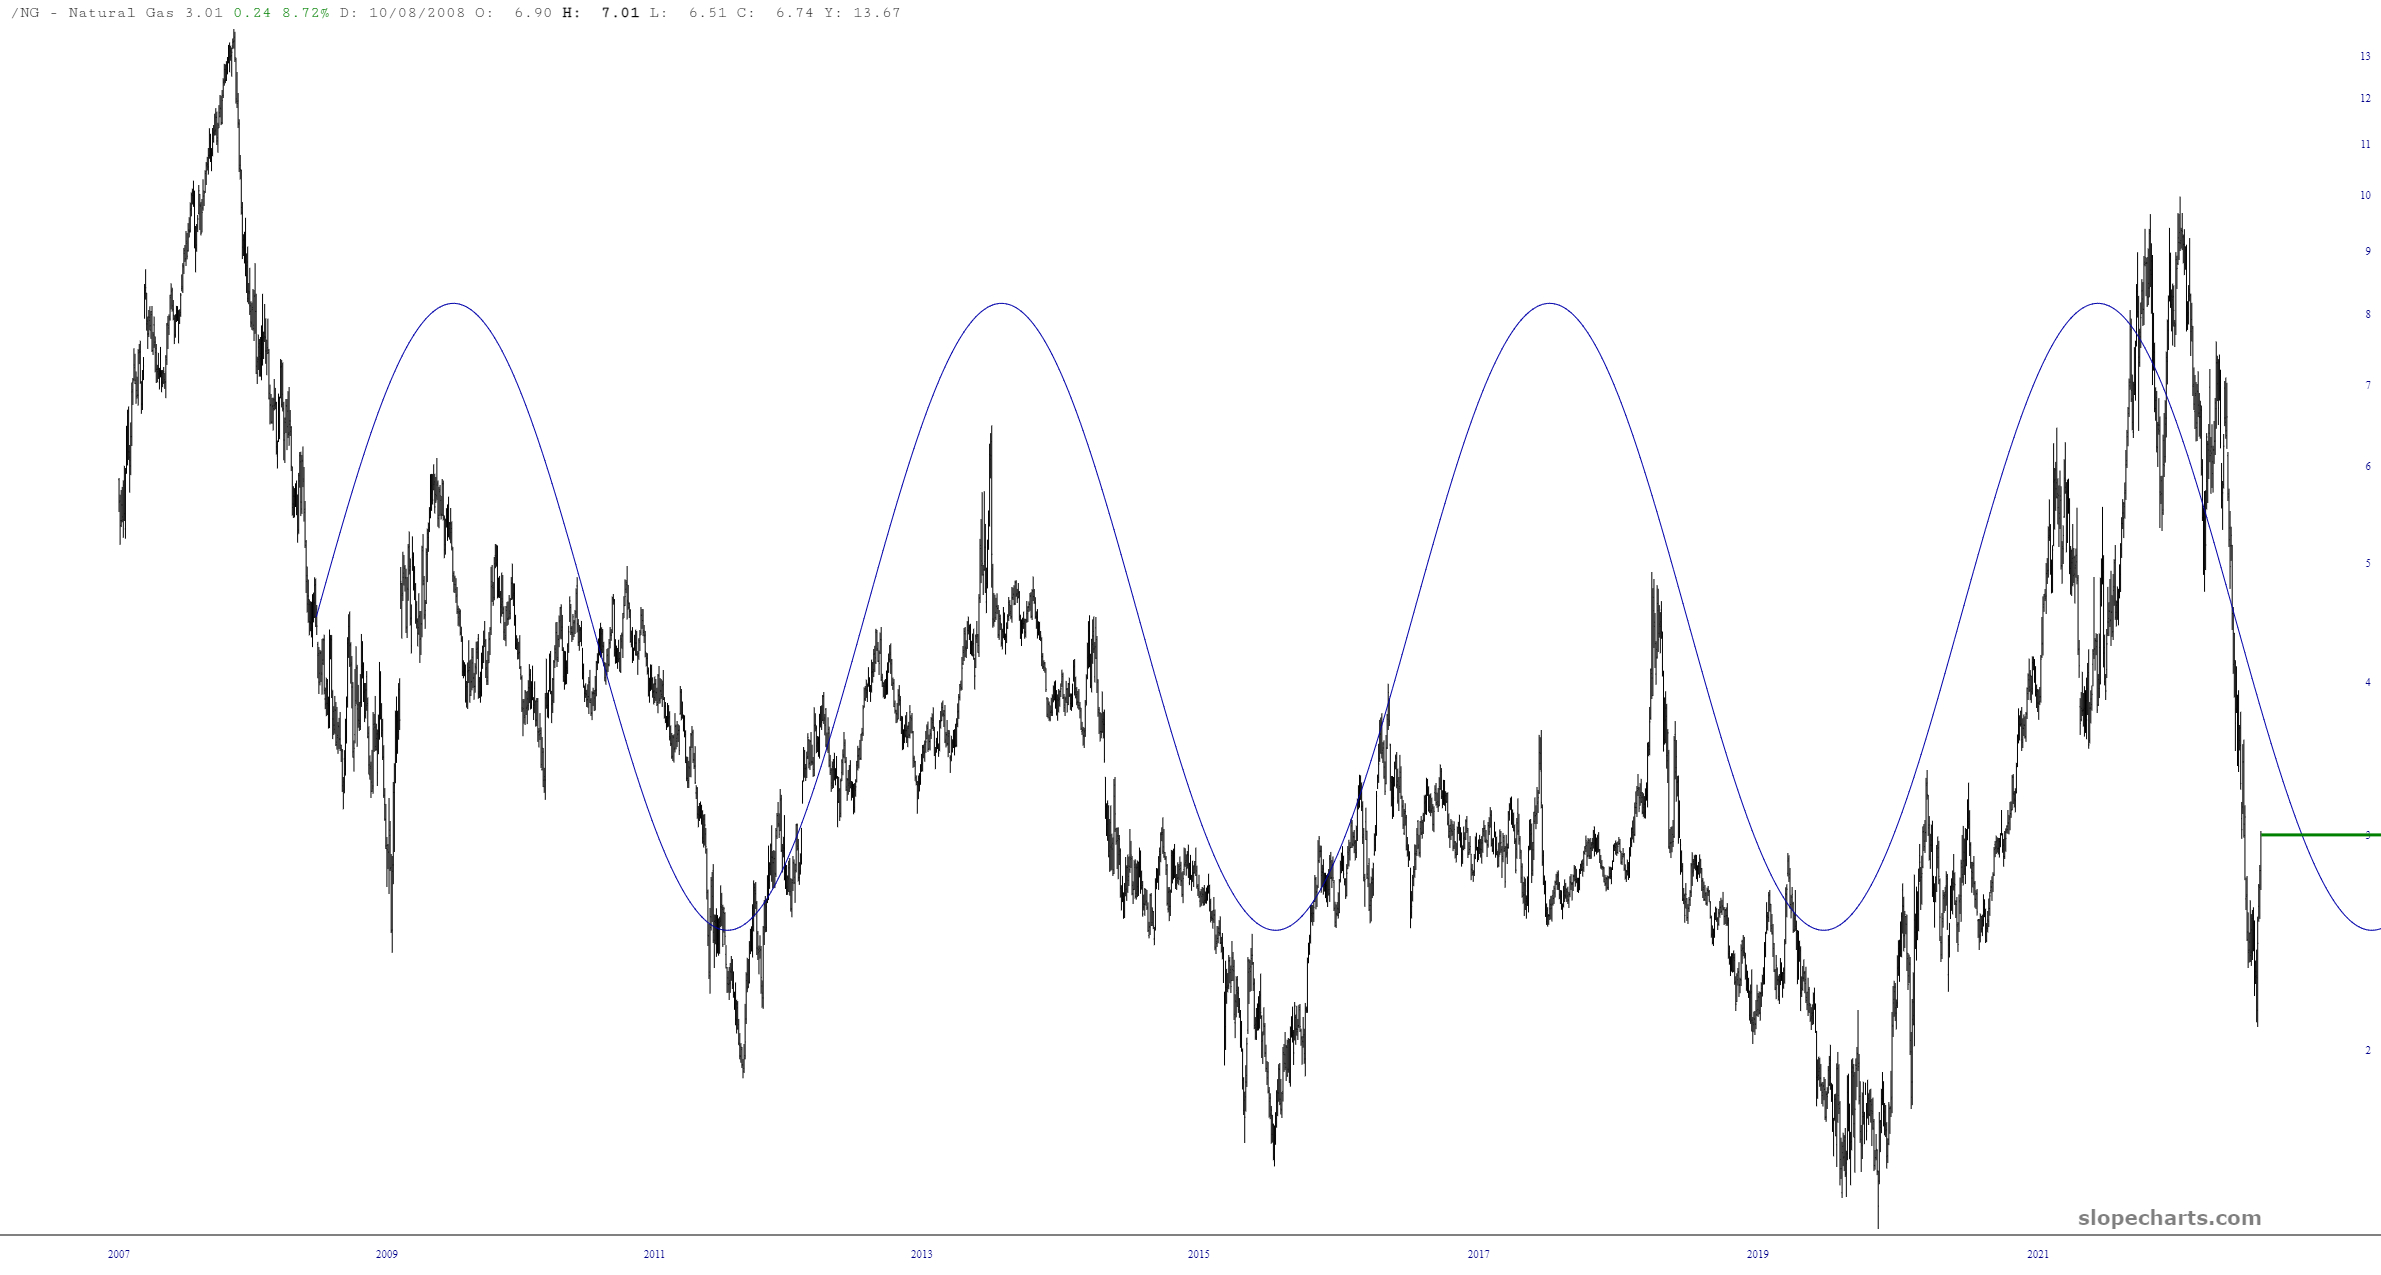
Recent lows seem to approximate a bottom, since they roughly match the lows seen over the long-term. We’ve bounced recently, but I’d suggest that if we encounter any other bout of weakness this quarter, it might be a good buying opportunity.
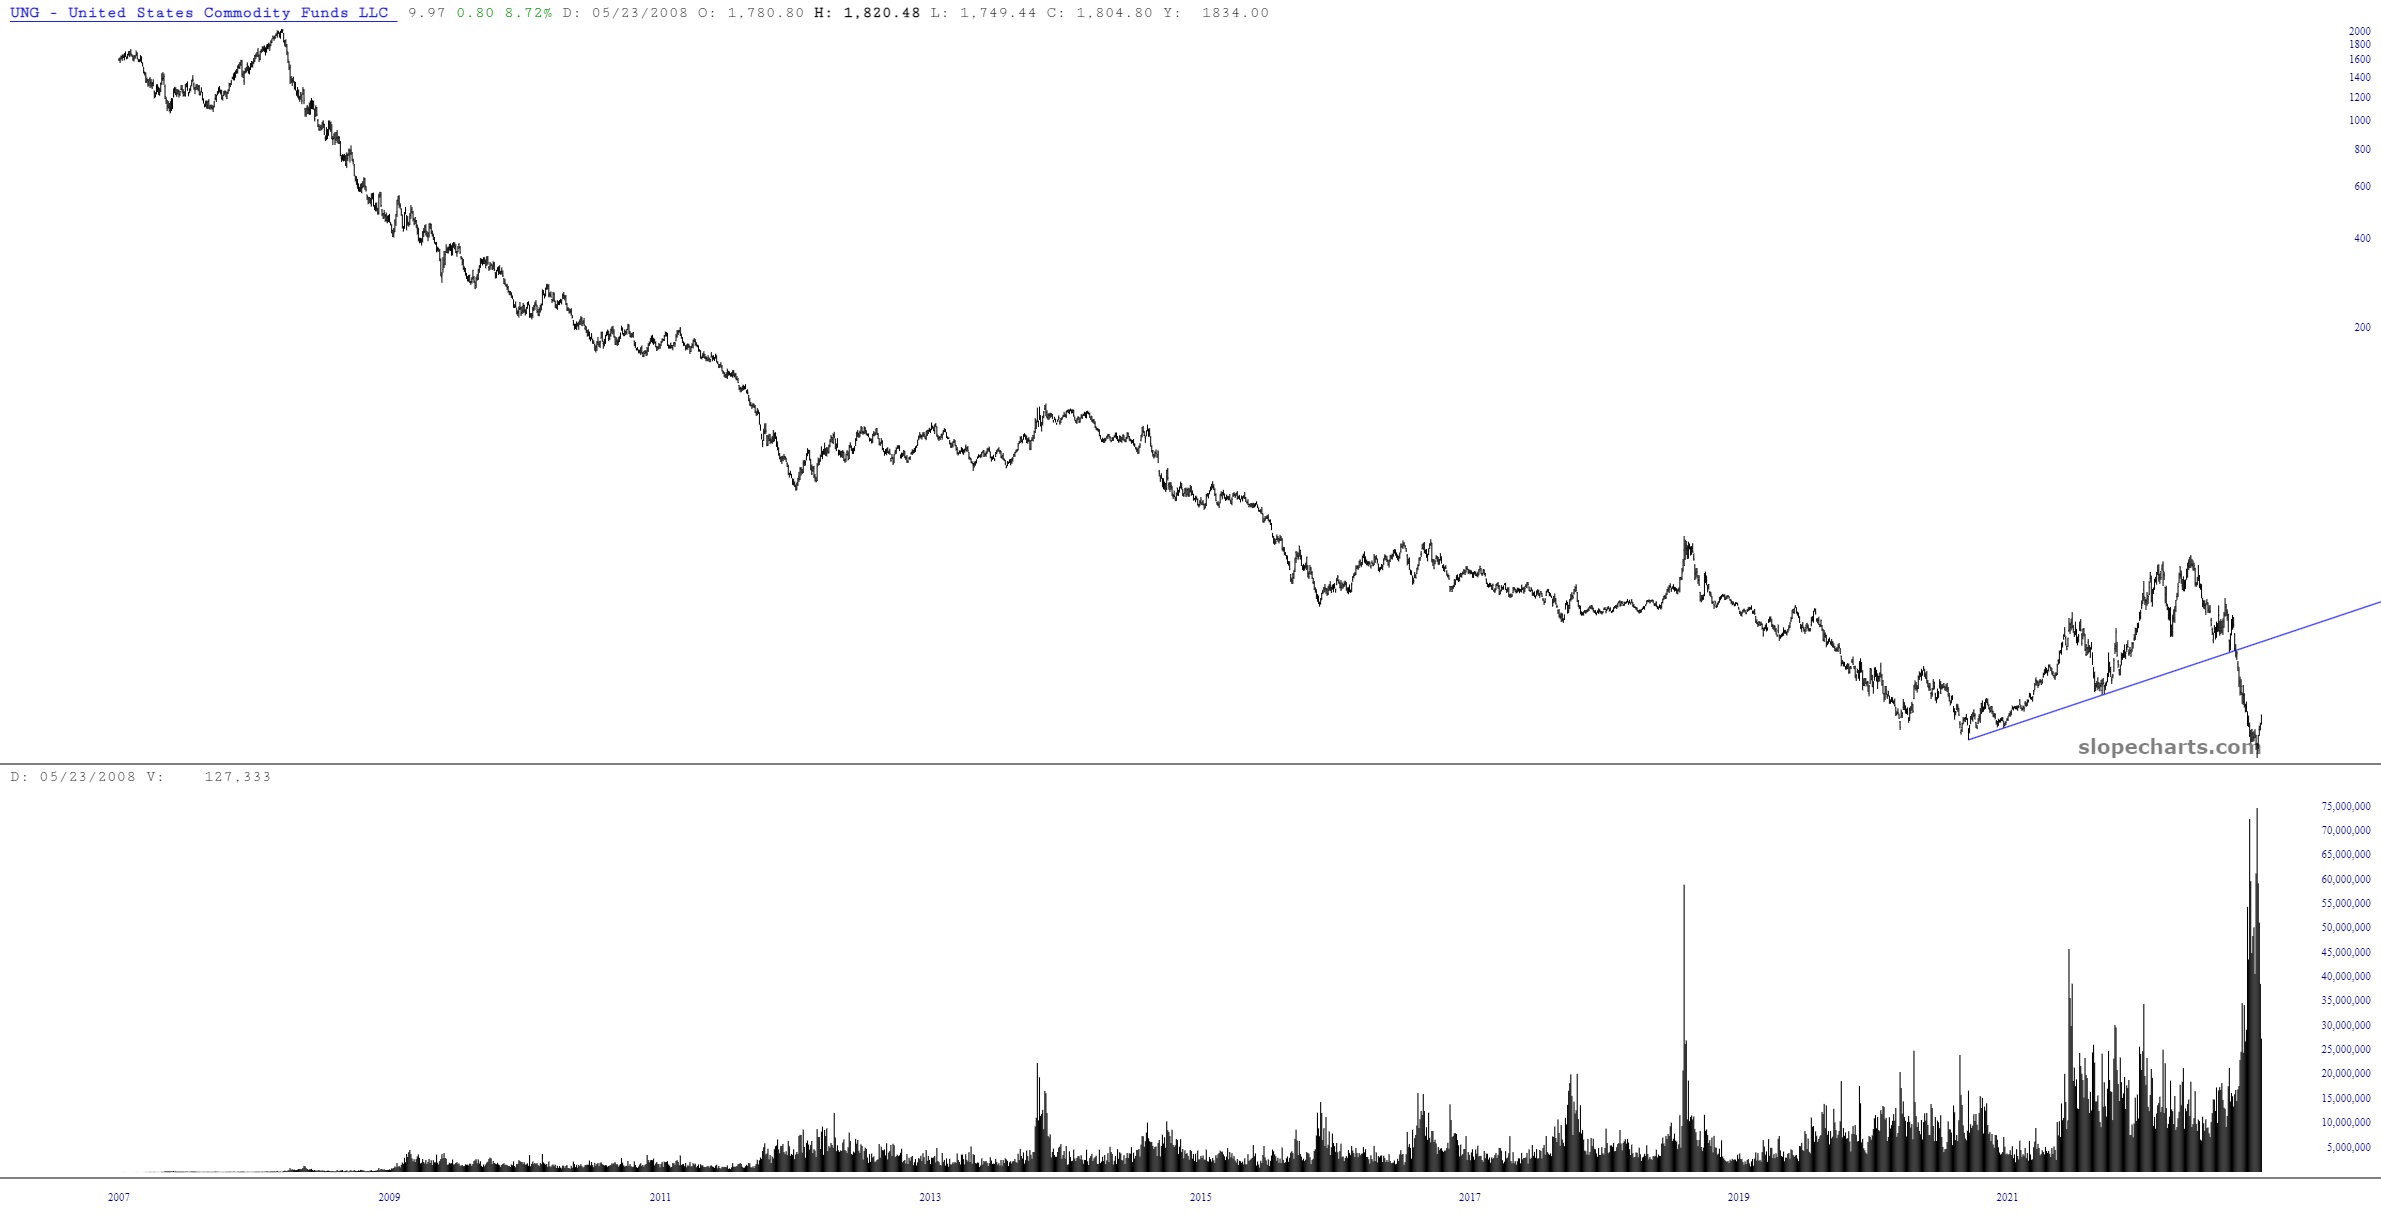
Take a look at the ETF symbol UNG, and in particular the surging volume related to this instrument.
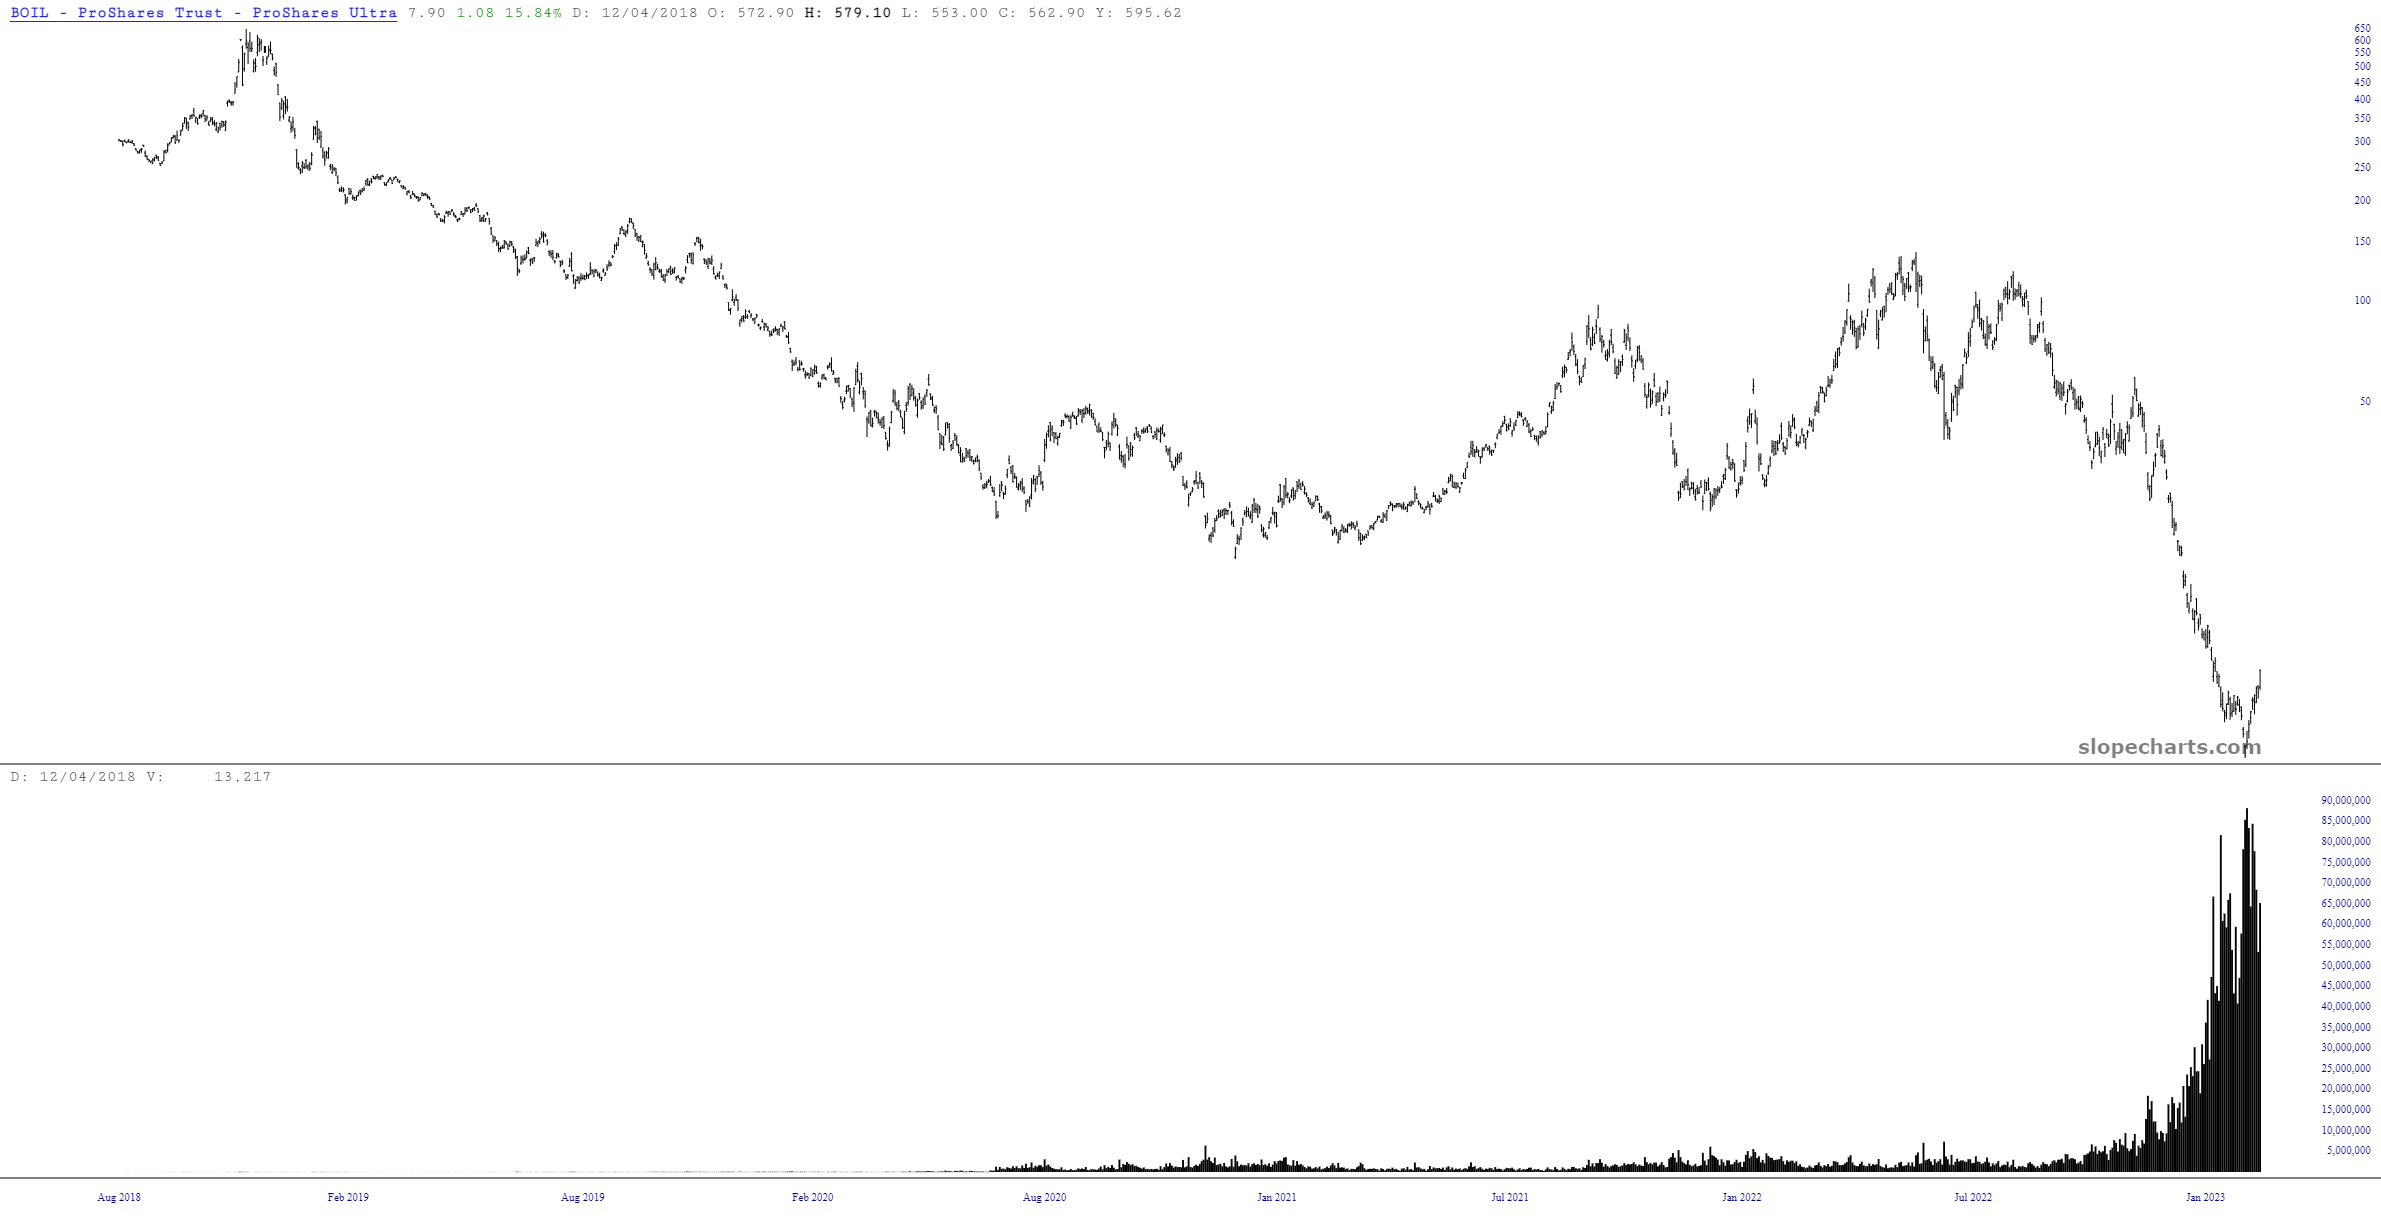
This is even more pronounced with the leveraged symbol BOIL
It’s impossible to nail tops and bottoms perfectly over such a long time horizon, but it seems very clear that natural gas is just about cheap right now as it was expensive a year ago.
