
In my post a week ago I was looking at the runaway move on Tech, and the way the move had just blown through some serious sell signals on SPX without breaking a sweat. These moves can end anytime of course, and it may well be that the move has ended, with a powerful rotation out of Tech and into the Dow and Russell 2000 over the last few days.
There is another decent setup for retracement on SPX and NDX here now and, with Tech in retreat, that may well deliver.
On SPX new daily RSI 14 and RSI 5 sell signals have fixed, after the first ones failed of course, and there is a decent looking nested double top setup that has already partially delivered. I’ll be looking at that in more detail in the fourth chart down on this post, the SPX 15min chart.
SPX daily chart:
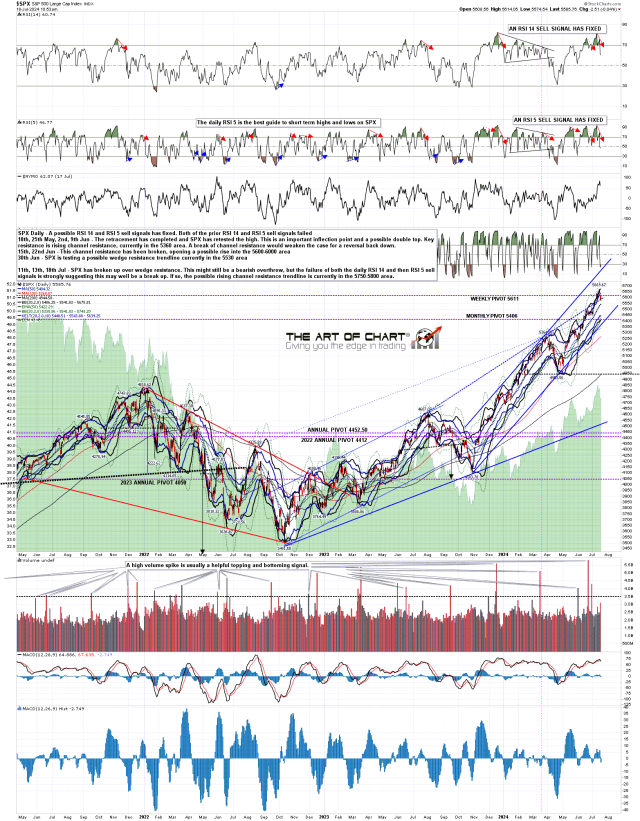
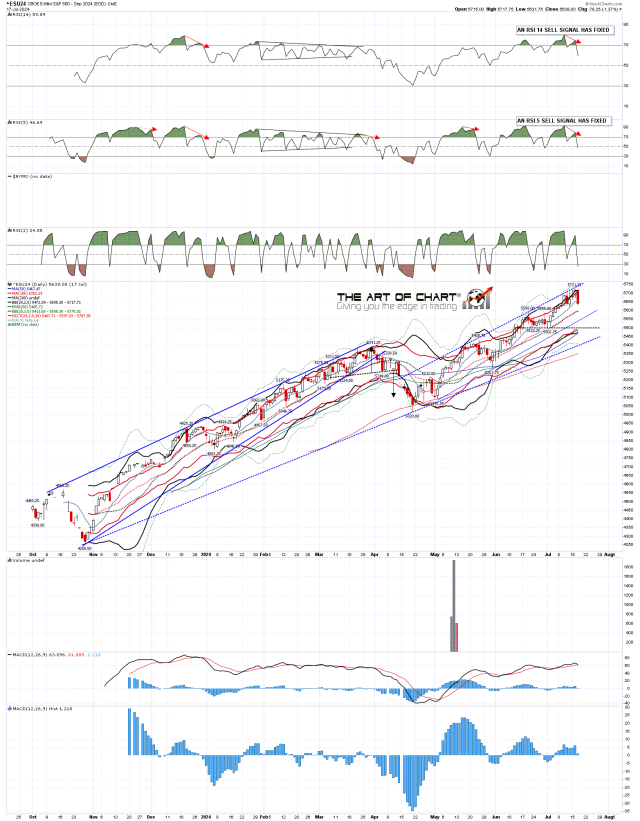
Daily RSI 14 and RSI 5 sell signals have now also fixed on ES, which didn’t happen last time, and the short term resistance trendlines also look decent. Both ES and SPX have come off the their daily upper band rides, and an obvious initial retracement would be their daily middle bands, currently in the 5595 area on ES, and 5539 area on SPX.
ES Sep daily chart:
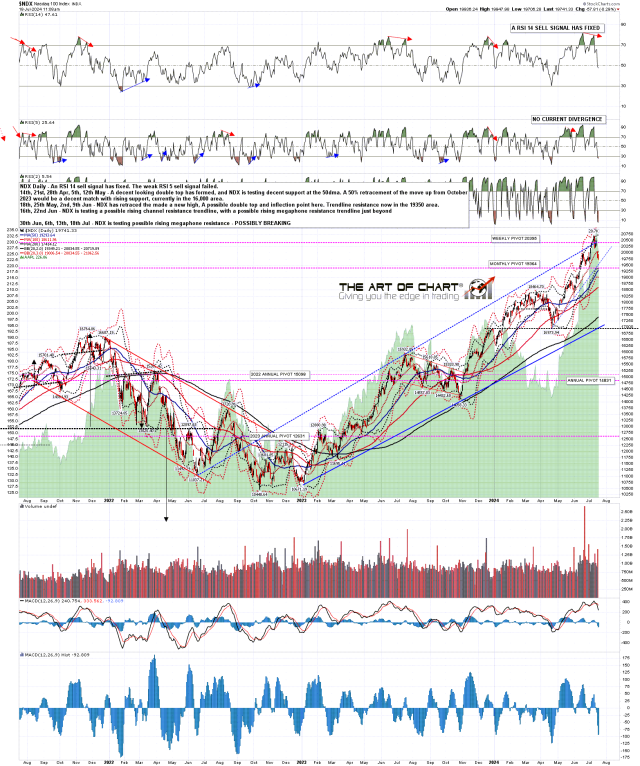
There was no fixed daily sell signal on NDX last time, but the negative divergence on the RSI 14 survived the move up, and that RSI 14 sell signal fixed with the others above at the close yesterday.
In a striking signal of relative weakness NDX also gapped down below the daily middle band yesterday and held that break into the close. That kind of break is a very strong way to break a support or resistance level and would usually follow through to the downside.
NDX daily chart:
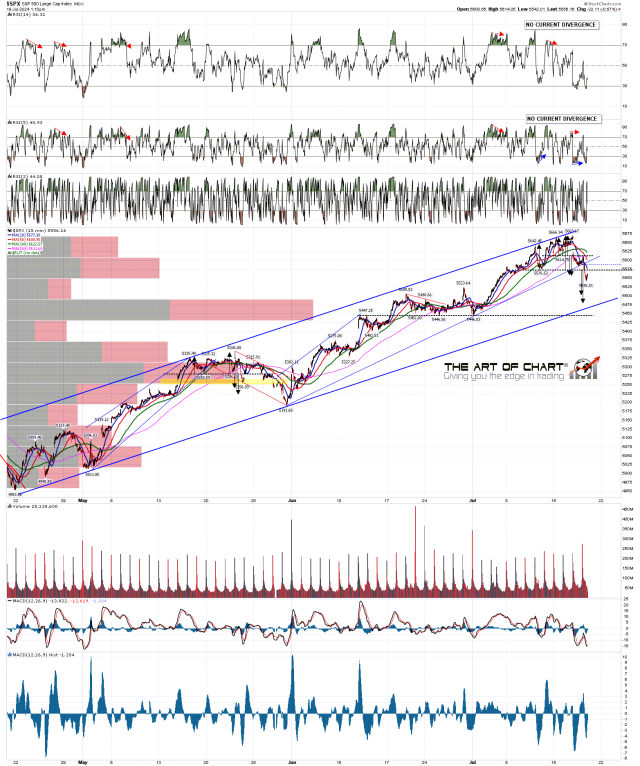
On SPX and ES there was a very nice looking nested double top setup on the high that I have been watching in my premarket videos, and that has partially played out, with the smaller double top having played out, and the larger one having broken down this morning. That has a target range in the 5480-5500 area, with larger support and a possible much larger H&S neckline in the 5450 area. On ES Sep the corresponding levels are a target in the 5520 area, and the larger support level in the 5500 area.
SPX 15min chart:
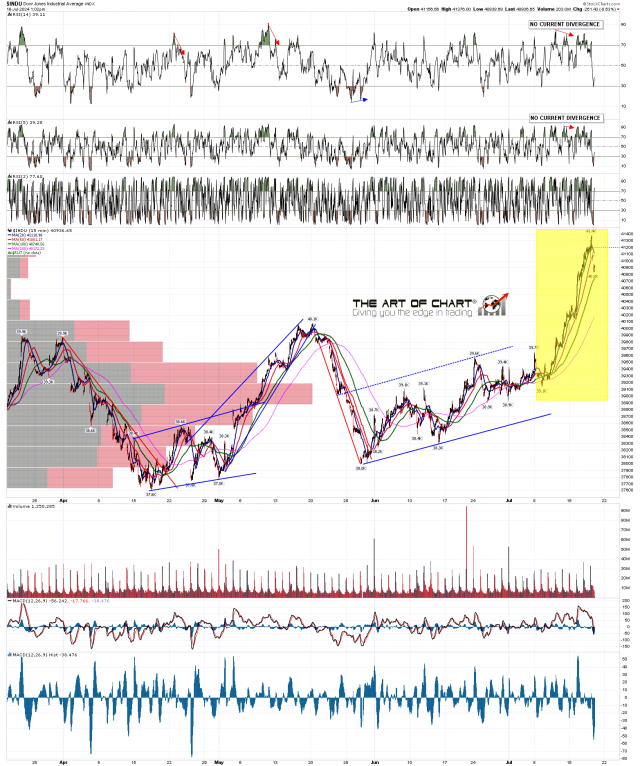
Will these downside targets be reached? Well this is a lovely setup on SPX and NDX to go lower, but I am a bit concerned that we may have traded a runaway move up on Tech for another runaway move on Dow and the Russell 2000. the Dow 15min chart below shows in the highlighted area the move up since 6th July. We have seen a little weakness there today, and over the last two days on the Russell 2000, but not much weakness overall so far. There is some negative divergence on both but an extended move down that is all Tech is unlikely to last long. We’ll see.
INDU 15min chart:
This will be my only post on indices this week, but I’m planning a crypto post tomorrow and will likely include an equity index chart there if anything looks interesting.
