
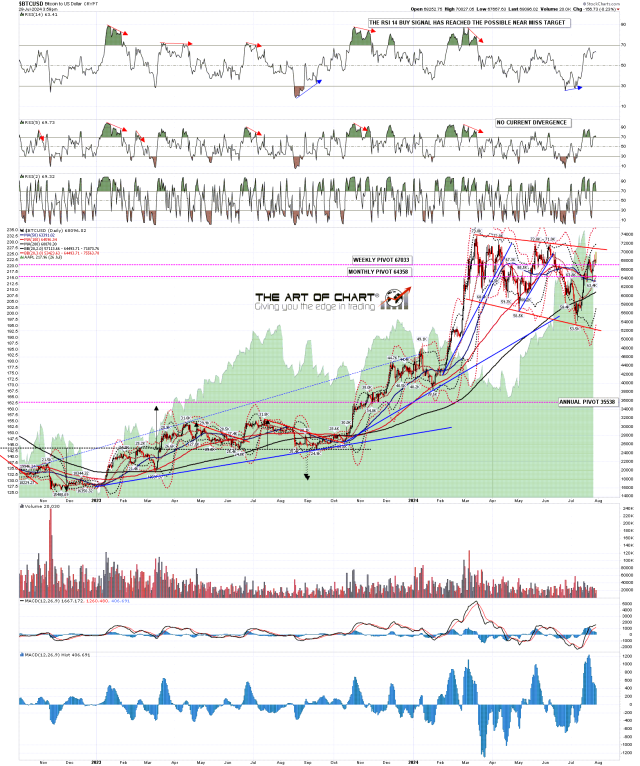
I called a possible swing low on cryptos on 5th July, and that’s been progressing as expected so far, and BTCUSD (Bitcoin) is now getting very close to bull flag resistance.
Bear flag resistance on Bitcoin is in the 70,600 area, and that is now getting very close. If that breaks then the flag target will be a retest of the all time high at 73.8k. Bitcoin has come off the daily upper band ride, and I am wondering about a possible backtest into the daily middle band, now in the 64,444 area, supported by the monthly pivot at 64,358, and with the 50dma not far below now at 63,371.
BTCUSD daily chart:
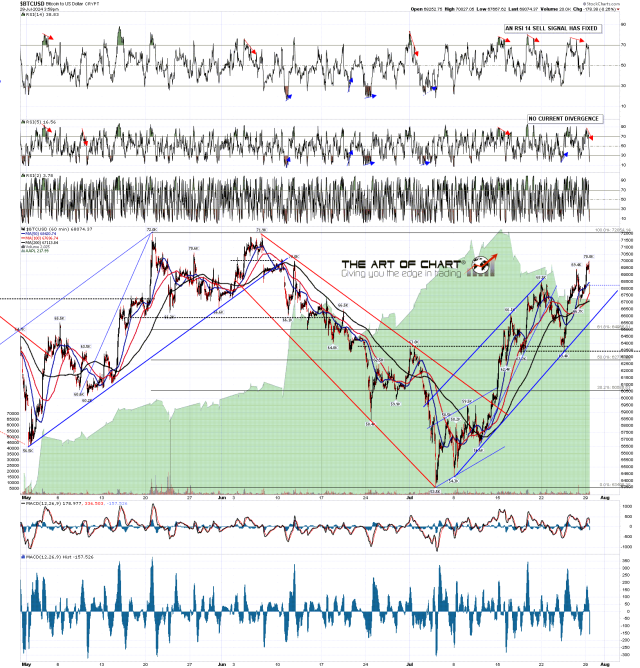
On the hourly chart the RSI 14 sell signal is reaching the target area, and there is a possible small double top target at 66.7k, and a sustained break below would look for a target 63.3k to 64.0k area. That could deliver that possible daily mid band backtest.
BTCUSD hourly chart:
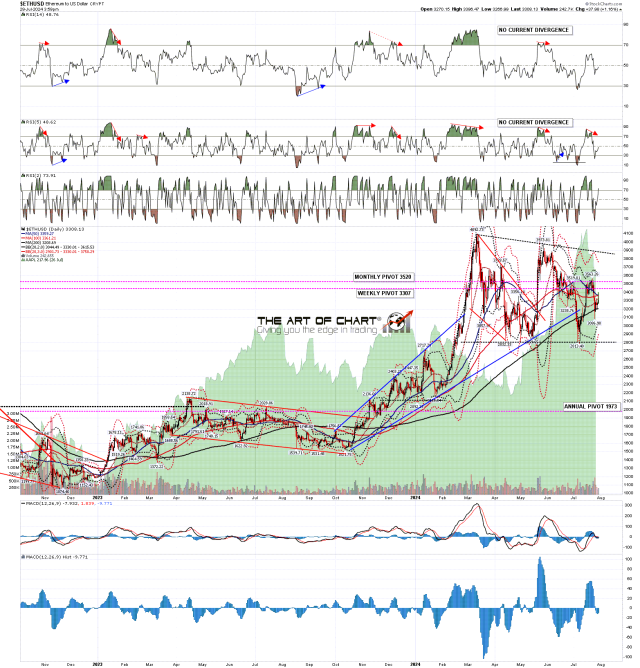
On ETHUSD (Ethereum), the bull flag resistance in the 3,890 area is further away and a daily RSI 5 sell signal fixed and made target last week. Ethereum has been the weakest on the move up from the early July lows, and I’d like to see it continue to hold support at the 200dma, now in the 3208 area, and then get back over the daily mid band now at 3328, and the 50dma, now at 3359.
ETHUSD daily chart:
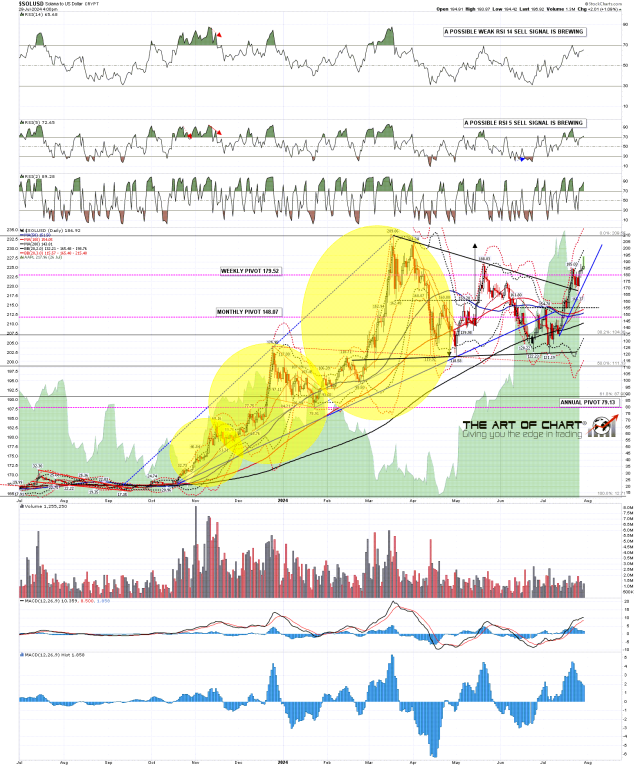
SOLUSD (Solana) has already broken back well above the obvious bull flag resistance, and has a still confirmed flag target back at a retest of the 2024 high at 209.86, as it has now made a higher high over the May 2024 high at 188.83.
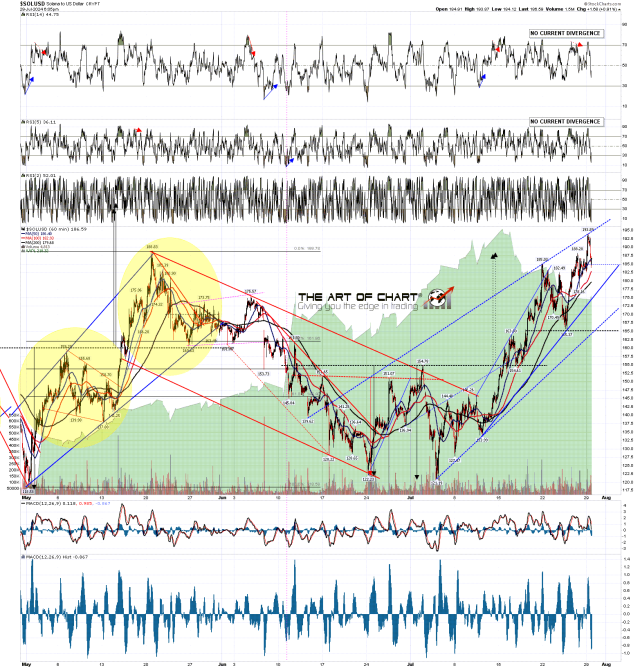
I would note though that there are now possible weak RSI 14 and full RSI 5 sell signals brewing on the daily chart. Those are only potential sell signals at this stage, but as we saw on Ethereum last week, those can fix and trigger a sharp retracement. If see the two key levels to watch would be short term rising support in the 176 area, and the daily middle band now in the 165.38 area.
SOLUSD daily chart:
On the Solana hourly chart the double bottom target in the 188 area was reached with a high at 193.89 over the weekend. That has confirmed the bull triangle target at 209.86.
Shorter term though there is a decent quality rising wedge forming from the last lows. Short term rising support from 133.39 is now in the 176 area, and there is a second possible rising support trendline from the low at 121.19 that is currently in the 166 area, and if this rising wedge continues to form, then that would become the obvious target on a break below the first trendline support in the 176 area, and with the daily middle band also now in the 165/6 area.
SOLUSD hourly chart:
Overall the bull setup on these cryptos is looking good, with a possible retracement starting here, and in my view there is a decent chance that all three are on the way to retests of their all time highs over coming weeks and months, with that closest on Bitcoin, and still some distance away on Ethereum and Solana. launches of spot (rather than futures based) ETFs on Ethereum and Solana would help that a lot, and we may be seeing both approved and launched in coming months.
I have a question for everyone reading. I’ve been covering these cryptos for a while but only started doing regular posts on these in recent weeks. Where should I be publishing these posts as well to reach a large audience interested in crypto? Suggestions very welcome.
I’ve stopped using a custom domain for my blogger posts so the address for those has reverted back to https://channelsandpatterns.blogspot.com/
If you are enjoying my analysis and would like to see it every day (including a daily premarket video) at theartofchart.net, which I co-founded in 2015, you can register for a 30 day free trial here. It is included in the Daily Video Service, which in turn is included in the Triple Play Service.
